50 Shades of Value: Is Value Back?


The idea behind value investing is simple—less-expensive companies tend to outperform more-expensive companies in the long term. Investors have two main arguments why this investment style works: behavioral biases and risk premiums. Most investors focus on stocks with a narrative about future growth, thus making already undervalued stocks less expensive than they should be. Value stocks should also compensate investors for higher levels of risk given their attractive valuations. Despite these arguments, value as a factor has lagged the market over the last 10 years, but recent market activity is starting to point to a potential comeback in this investment style.
In Part I of this blog series, we wrote that there are many ways of accessing value, and investors should be aware of those definitions because they will impact a strategy’s exposures and returns. At WisdomTree, we have two ways of accessing value domestically: our dividend- and earnings-weighted Index families. Once a year, WisdomTree’s dividend-weighted Indexes will weight dividend payers by their aggregate share of indicated dividends to be paid. Likewise, the earnings-weighted Indexes are reconstituted annually, weighting companies with positive earnings by their proportionate share of total aggregate earnings. We believe our dividend-weighted family represents a deeper cut of value because it removes zero-dividend-paying (growthier) stocks from the investment universe.
Dividend Payers Trailing, but Is the Trend Reversing?
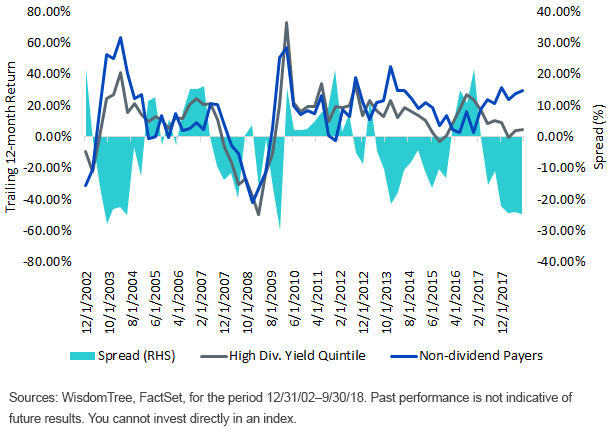
Dividend payers have been under pressure since late 2016. As of the end of September 2018, the MSCI USA Information Technology Index, generally constituted of non-dividend payers, had outperformed the dividend-heavy MSCI USA Utilities Index by more than 13% annually since December 30, 2016.1 In fact, the spread in trailing 12-month returns between non-dividend payers and the highest dividend-yielding quintile within the S&P 500 Index reached its 10-year maximum at the end of this period. As can be seen in the chart below, the last two times this difference in returns hit such levels, in 2003 and 2009, there was a quick reversion to the mean.
S&P 500 Index: Highest Dividend Yields vs. Non-Dividend Payers
Trailing 12-Month Returns

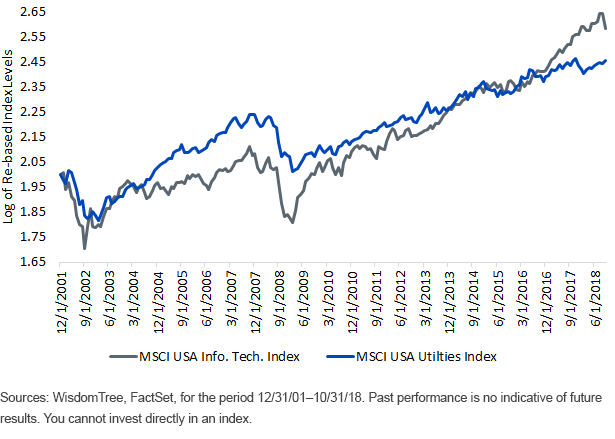
During the second half of 2018 and more magnified in the recent market sell-off, we’ve seen defensive sectors commonly associated with the value factor begin to outperform the growth sectors in the market. In the chart below, we show the log of re-based index levels for the MSCI USA Utilities and Information Technology Indexes. This log chart allows us to visually compare the performance of both indexes over a given period by comparing the steepness in the lines. Comparing this chart to the one above, we can see that periods where non-dividend payers outperform the highest dividend-yielding quintile coincide with periods where the MSCI USA Information Technology Index outperforms the MSCI USA Utilities Index, having a steeper line. During October, the MSCI USA Utilities Index outperformed the MSCI USA Information Technology Index by almost 15%,2 and we can see that this outperformance began a few months ago as the blue line has been getting steeper while the gray line inverts.
MSCI USA Utilities Index vs. MSCI USA Info. Tech. Index

Gaining Exposure
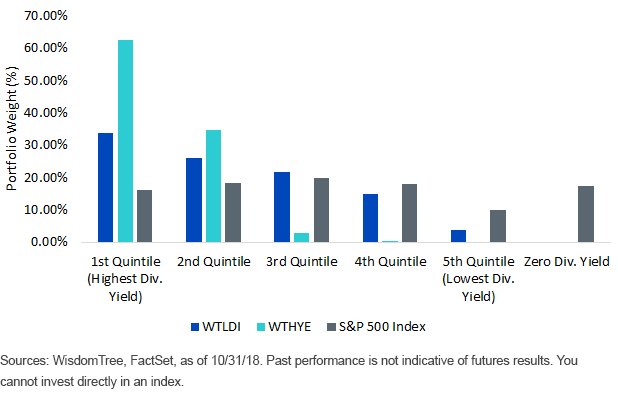
If value is coming back and dividend-paying companies are on the verge of a significant rebound, strategies like WisdomTree’s dividend-weighted Indexes can help investors manage their U.S. allocation. As shown below, the WisdomTree U.S. LargeCap Dividend Index (WTLDI) and the WisdomTree U.S. High Dividend Index (WTHYE) are significantly over-weight in the highest dividend-paying quintiles compared with the S&P 500 Index. WTLDI has a balanced tilt to value and can be considered as a core holding in a portfolio. It has provided downside protection in moments of market turmoil and has the potential of outperforming when value trends. On the other hand, WTHYE is a deeper-value index that tends to provide significant downside protection because it has over 50% of its weight in defensive sectors, but this interest-rate sensitivity can make it difficult to hold in a rate sell-off like the one we experienced in February. There are many shades of value, and being aware of the differences can ensure appropriate exposure.
Exposure to Dividend Payers

1Source: Bloomberg, as of 9/28/18.
2Source: Bloomberg, as of 10/31/18.
Alejandro Saltiel joined WisdomTree in May 2017 as part of the Quantitative Research team. Alejandro oversees the firm’s Equity indexes and actively managed ETFs. He is also involved in the design and analysis of new and existing strategies. Alejandro leads the quantitative analysis efforts across equities and alternatives and contributes to the firm’s website tools and model portfolio infrastructure. Prior to joining WisdomTree, Alejandro worked at HSBC Asset Management’s Mexico City office as Portfolio Manager for multi-asset mutual funds. Alejandro received his Master’s in Financial Engineering degree from Columbia University in 2017 and a Bachelor’s in Engineering degree from the Instituto Tecnológico Autónomo de México (ITAM) in 2010. He is a holder of the Chartered Financial Analyst designation.

