
Factor-Balanced Equal Weighting


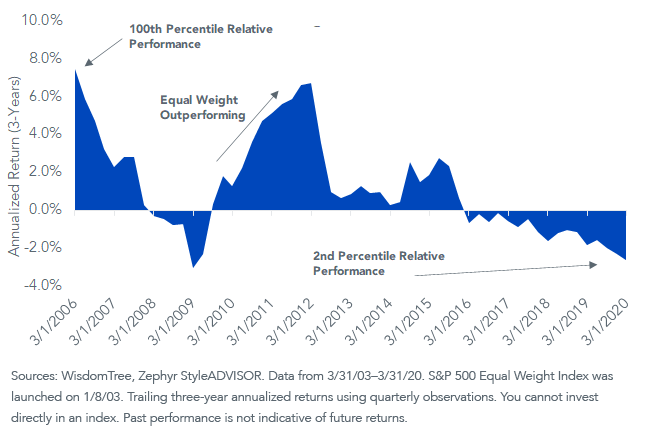
The S&P 500 Equal Weight Index (S&P 500 EW)—a proxy for the average performance of U.S. stocks—has lagged the S&P 500 by 261 basis points (bps) annualized for the last three years.
This relative performance ranks in the second percentile since inception of the index in 2003.1
The equal-weighted Index has outperformed the market cap-weighted Index since inception by 101 bps annualized, with a pattern of significant multi-year outperformance in the years immediately following the early 2000s recession and the financial crisis.
S&P 500 Equal-Weight Minus S&P 500
Despite addressing some of the major drawbacks associated with market cap weighting—such as concentration and expensive valuations—the S&P 500 EW does not provide investors with the best tool to improve diversification at the portfolio level, due to its high correlation (and high beta) relative to the S&P 500 Index.
WisdomTree’s Approach to Equal Weighting
The WisdomTree U.S. Multifactor Index (WTUSMF) invests in mid- and large-cap U.S. equities in a way that closely resembles equal weighting. The Index selects 200 securities with a high combined multifactor score for several widely accepted factors: value, quality, momentum and low correlation.
These 200 constituents are weighted using a normalized factor score. The Index has significantly less weight allocated to its top 10%—or largest 20 constituents—than the S&P 500 Index, and its weighting distribution is closer to the equal-weighted distribution of the S&P 500 Equal Weight Index.
Percent of Total Weight in Each Market Cap Decile

Diversification Potential
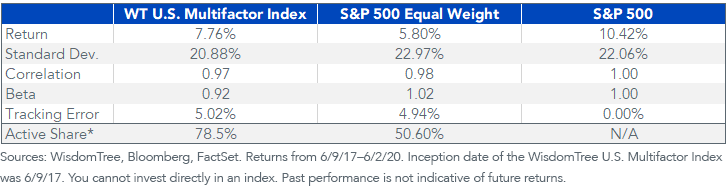
One way to measure the diversification potential a strategy can offer to an S&P 500 position is with risk and return characteristics.
Over this almost three-year period, the Equal Weight Index had roughly 90 bps of greater risk (or standard deviation) than the S&P 500 and a beta of 1.02.
WTUSMF had less risk than the S&P 500, contributing to its lower beta of 0.92. It also had a modestly higher tracking error than the S&P 500 EW.
Annualized Risk/Return Statistics
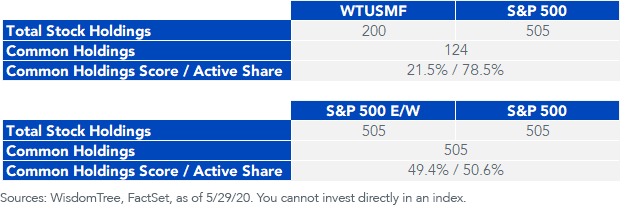
Another measure of diversification is in the common holdings, or active share. In the below tables, we show the number of holdings that are common to each Index, as well as a common holdings score/active share to show how common/different the weights are between the two Indexes.
The S&P 500 EW has an active share of 51% to the S&P 500, which is quite a bit lower than the 78% for WTUSMF. Part of the explanation is that each Index holds the same 505 securities. WTUSMF, on the other hand, selects just 200 securities from a starting universe of 800 of the largest U.S. companies by market cap. Only 123 securities in WTUSMF are also in the S&P 500 Index.
Blending Value and Quality
As expected, the equal-weighted S&P 500 has better value characteristics across the board relative to the S&P 500. The trade-off is lower profitability, or exposure to the quality factor.
The stock selection model for WTUSMF balances exposure to value and quality. By selecting on both of these characteristics, it aims to own securities that have above-average scores on both factors. It offers lower valuations than the S&P 500 and higher profitability, as measured by return on assets and return on equity.
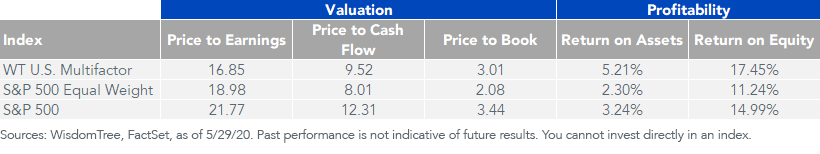
For definitions of terms in the table, please visit our glossary.
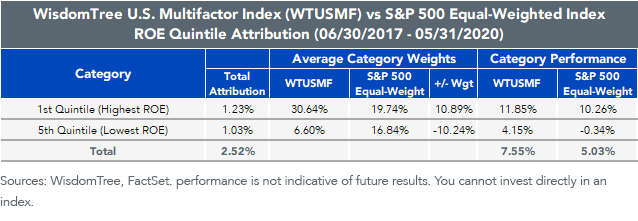
From a return on equity (ROE) quintile attribution on since inception performance, WTUSMF was over-weight in the highest ROE quintile relative to the S&P 500 EW and under-weight in the lowest ROE quintile. The total attribution from these two quintiles contributed about 225 bps of annualized outperformance.
A More Diversified Equal Weighting
There are many tactical and strategic tailwinds that may favor equal weighting versus market cap weighting U.S. equities. For most strategic asset allocators, allocation decisions need to be made from a portfolio construction context, making the consideration of things that we have discussed—like active share, tracking error and beta to existing positions—important.
The WisdomTree U.S. Multifactor Index aims to offer a diversified investment to traditional core positions while balancing its exposure to factors associated with outperformance over the long run.
1Sources: WisdomTree, Zephyr StyleADVISOR, 3/31/03–3/31/20. Rolling three-year annualized returns using quarterly observations. Inception of the S&P 500 Equal Weight Index was January 8, 2003.
Share & Comment
Popular Posts
Categories
Related Links
Alejandro Saltiel joined WisdomTree in May 2017 as part of the Quantitative Research team. Alejandro oversees the firm’s Equity indexes and actively managed ETFs. He is also involved in the design and analysis of new and existing strategies. Alejandro leads the quantitative analysis efforts across equities and alternatives and contributes to the firm’s website tools and model portfolio infrastructure. Prior to joining WisdomTree, Alejandro worked at HSBC Asset Management’s Mexico City office as Portfolio Manager for multi-asset mutual funds. Alejandro received his Master’s in Financial Engineering degree from Columbia University in 2017 and a Bachelor’s in Engineering degree from the Instituto Tecnológico Autónomo de México (ITAM) in 2010. He is a holder of the Chartered Financial Analyst designation.