
Can You Time an Earnings-Weighted Approach?


As investors grapple with the risk of a recession this year, we wanted to analyze how our Indexes performed in different economic scenarios.
Equity markets are “forward-looking.” The risk of an impending recession is oft-discussed at the moment (early 2023), and equities price this risk. By the time we receive an official confirmation of a recession, share prices could already be starting to price in an economic recovery.
In this piece, we evaluate WisdomTree’s earnings strategies across the market cap size spectrum to showcase outperformance (or underperformance) against benchmarks during specific parts of the given business cycle.
The most intriguing results are in the small-cap segment of the market, where a focus on profitability mattered whether the business cycle was strongly positive or strongly negative. Let’s dig in.
Defining Stages of the Business Cycle
Just as equity markets are “forward-looking” in their focus, we look at an economic cycle indicator that is also forward-looking. The National Bureau of Economic Research (NBER) takes time to define periods of economic expansion and contraction—and they do so in hindsight; equity markets are not trading based on these characterizations.
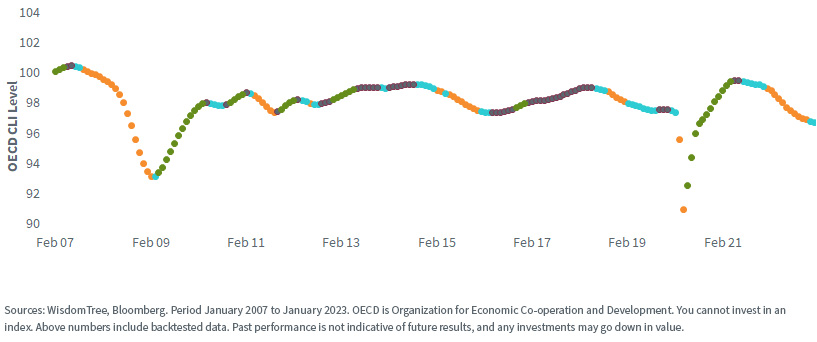
Figure 1 looks at the behavior of the Organization of Economic Co-operation and Development (OECD) Composite Leading Indicator from January 2007 to January 2023—the live history of WisdomTree’s earnings-weighted strategies. This is a leading indicator, and it defines four distinct conditions:
- Strongly Negative Signal: This would be defined by the color red and note periods where the forward-looking economic data looks especially poor.
- Negative Signal: This would be defined by the color orange and note periods where the forward-looking economic data could be more mixed but tilts in aggregate more negative than positive.
- Positive Signal: This would be defined by the color blue and note periods where forward-looking economic data could be more mixed but tilts in aggregate more positive than negative.
- Strongly Positive Signal: This would be defined by the color green and note periods where forward-looking economic data could be viewed as strongly positive.
This framework helps characterize historical periods in terms of forward-looking economic data that equities respond to.
Figure 1: The Organization for Economic Co-operation and Development (OECD) Composite Leading Indicator
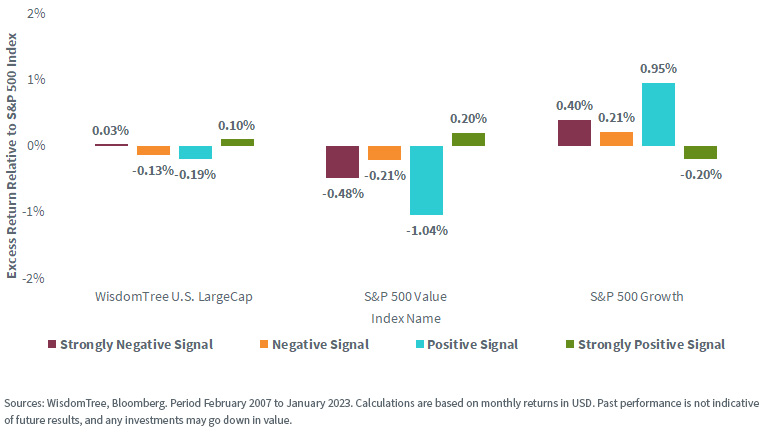
WisdomTree U.S. LargeCap Index vs. S&P 500 Index, as well as the Value and Growth Variants
Figure 2 compares the average outperformance of the specified Index against the S&P 500 Index benchmark over the quarter following a given signal being observed. For instance, if a strongly positive signal is observed, we would then look at the next three months of performance for the WisdomTree U.S. LargeCap Index against the S&P 500 Index.
- A positive number tells us that, on average, the WisdomTree Index is outperforming.
- Similarly, a negative number tells us that, on average, the WisdomTree Index is underperforming.
The WisdomTree U.S. LargeCap Index is designed to be 500 profitable large market-capitalization companies. Maybe not every company in the S&P 500 Index is currently profitable, but it is the case that every company had to prove its capability to be profitable prior to gaining initial inclusion.
The low degree of difference between the S&P 500 Index and the WisdomTree U.S. LargeCap Index led to a low difference in performance between these Indexes across the different types of environments defined by the leading indicator. An earnings-weighted approach is going to have two sources of possible difference from a market-capitalization benchmark:
- Exclusion of unprofitable, more speculative companies.
- Different weighting of companies included in both Indexes, as weighting by profits can look very different than weighting by market capitalization.
It is harder for this type of approach to exhibit large differences versus the S&P 500 Index within a large market-capitalization universe of 500 stocks.
Figure 2: Large-Cap Indexes vs. S&P 500 Index Benchmark over Different Parts of the Business Cycle
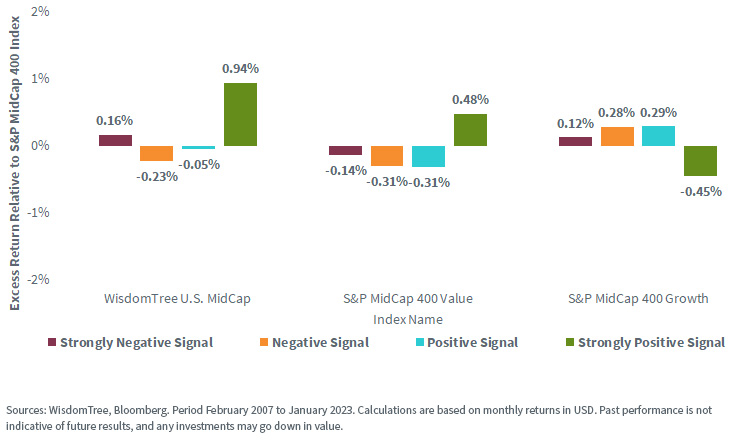
WisdomTree U.S. MidCap Index vs. S&P MidCap 400 Index, as well as the Value and Growth Variants
Figure 3 shows the relative outperformance with a mid-cap universe of underlying benchmarks. The results, however, look very different than what we saw in figure 2.
- Once one dips below large caps in size, an earnings-weighted approach and a market capitalization-weighted approach diverge more because, in mid-caps, there are more unprofitable, currently speculative companies.
- Best Results during Expansions: We see, in the case of the WisdomTree U.S. MidCap Index, a rather largely positive green bar. This is telling us that once the indicator is defining the period as “Strongly Positive,” the average return of the WisdomTree U.S. MidCap Index versus the S&P MidCap 400 Index showed a difference of 0.94% in favor of the WisdomTree Index over the following quarter, or three months of time. The bulk of the WisdomTree Index’s outperformance historically came during the “Strongly Positive” periods.
- But Also Positive during Contractions: The red bar was also positive, and on average, the WisdomTree U.S. MidCap Index outperformed the S&P MidCap 400 Index by 0.16% during three-month periods defined as “Strongly Negative.”
A strategy that can outperform a benchmark during both strongly negative and strongly positive periods of the economic cycle might be a coveted “all-weather” type of strategy, where one could then be less concerned about forward-looking economic conditions as there could be confidence in the performance potential of the approach regardless of what transpired.
Figure 3: Mid-Cap Indexes vs. S&P MidCap 400 Index Benchmark over Different Parts of the Business Cycle
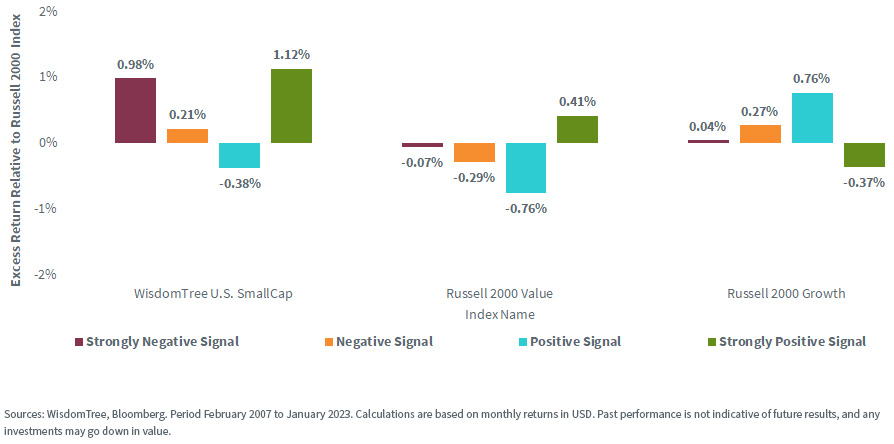
WisdomTree U.S. SmallCap Index vs. Russell 2000 Index, as well as the Value and Growth Variants
In figure 4, we similarly evaluate small caps. These were the most interesting results of all.
- The Russell 2000 Index is well-known as an extremely inclusive Index. Initial profitability is not a requirement for constituent inclusion. The Russell 2000 Index typically has significant exposure, ranging from 20% to 30%, allocated to companies that are unprofitable.
- Additionally, market capitalizations can fluctuate quickly amidst small-cap stocks for many reasons. This leads to a greater degree of difference when one is using earnings to weight stocks rather than market capitalization.
- All-Weather Results: For the WisdomTree U.S. SmallCap Index, the red bar AND the green bar are in the range of 1.00%—the red a bit below, the green a bit above.
- On average, the WisdomTree U.S. SmallCap Index outperformed the Russell 2000 Index over the three months following BOTH a strongly positive and a strongly negative reading on the indicator. This is based on roughly 16 years of live data and is a real Index track record, not a backtest or simulation.
Figure 4: Small-Cap Indexes vs. Russell 2000 Index Benchmark over Different Parts of the Business Cycle
Bottom Line: Through the Lens of Economic Conditions, Small Caps Offer the Greatest Potential Differentiated Performance against Benchmarks
Based on roughly 16 years of live performance, we see yet another example of the differentiation that can occur with a thoughtful approach to small-cap stocks.
2022 was a reminder that “profitability was again important.” Investors shunned speculative stocks that were winning in 2020 and 2021. People who still have small-cap allocations should consider comparing their approach to the WisdomTree U.S. SmallCap Index, as the evidence does suggest that over the last 16 years of returns, it was the “better benchmark.”
Share & Comment
Popular Posts
Categories
Related Links
Christopher Gannatti began at WisdomTree as a Research Analyst in December 2010, working directly with Jeremy Schwartz, CFA®, Director of Research. In January of 2014, he was promoted to Associate Director of Research where he was responsible to lead different groups of analysts and strategists within the broader Research team at WisdomTree. In February of 2018, Christopher was promoted to Head of Research, Europe, where he was based out of WisdomTree’s London office and was responsible for the full WisdomTree research effort within the European market, as well as supporting the UCITs platform globally. In November 2021, Christopher was promoted to Global Head of Research, now responsible for numerous communications on investment strategy globally, particularly in the thematic equity space. Christopher came to WisdomTree from Lord Abbett, where he worked for four and a half years as a Regional Consultant. He received his MBA in Quantitative Finance, Accounting, and Economics from NYU’s Stern School of Business in 2010, and he received his bachelor’s degree from Colgate University in Economics in 2006. Christopher is a holder of the Chartered Financial Analyst Designation.