
A Closer Look at U.S. IG & HY Corporates


Fixed income has both historically served as a diversifier and provided protection during times of market turbulence. However, the persistent low-yield environment since the global financial crisis (GFC) made it more challenging for fixed income to fulfill its traditional role.
Nevertheless, with the onset of quantitative tightening (QT) and the 475-basis-point increase in the Fed Funds Rate during the past year, fixed income now has a bigger cushion to serve as a diversifier once again. With income back in fixed income, it’s prudent to examine market composition more closely. We will specifically focus on U.S. corporate borrowers, analyzing both investment-grade and high-yield issuers across duration, quality and sector allocations.
Key Findings:
- Duration: Both indexes are getting shorter while issuers extend their debt profile.
- Quality: IG is getting more concentrated in BBBs, while BBs have grown to represent more than 50% of HY.
- Sectors: Financial exposure is significant in IG but remains restrained in HY.
Duration
Investment-Grade Duration Falling While Issuers Borrow Longer
Investment-grade (IG) index duration was rising before the COVID-19 pandemic, but it has fallen from the peak of 8.45 years at the end of 2020 to around 7 years at the end of March 2023 (figure 1). On the headline level, this means IG borrowers, as a whole, have lower sensitivity to interest rate risk compared to the last couple of years. However, we should keep in mind, due to the increased correlation between the IG spread and risk-free interest rates, empirical duration (true, realized sensitivity of index price to risk-free rate) has increased.
Contribution to Mod. Duration - IG
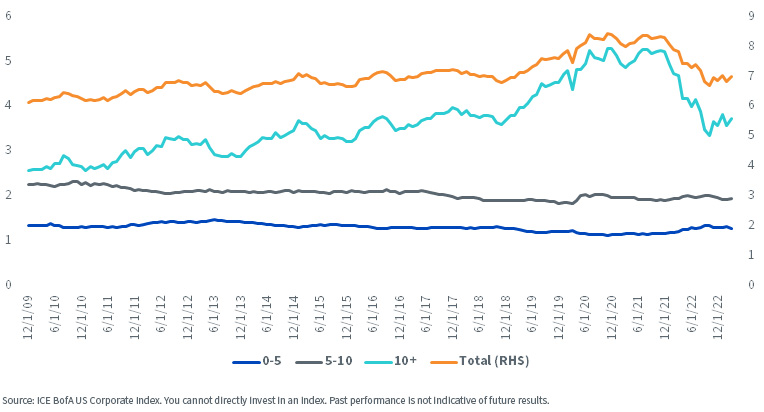
Historically, IG issues with longer duration have contributed more to the overall duration of the index, mainly due to their issuers’ higher creditworthiness and their ability to borrow for longer periods. This hasn’t changed in the aftermath of the pandemic and QT. However, what changed is the behavior of IG borrowers after the yield curve flattened last year. As can be seen from figure 1, index duration and the contribution of long issues to overall duration are on the rise, which indicates IG issuers are taking advantage of a flat yield curve and extending the duration of their debt.
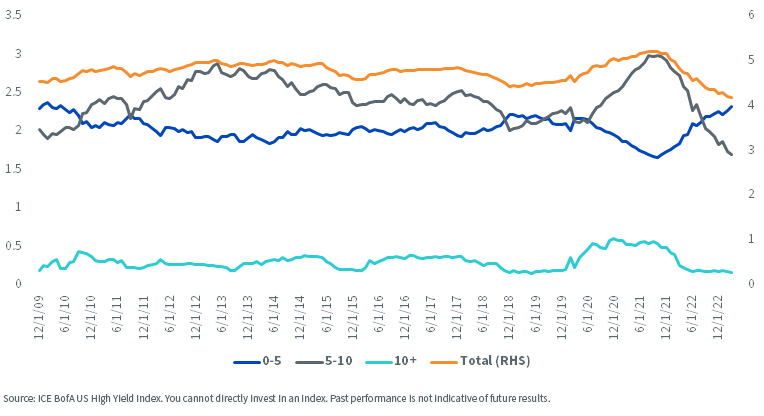
High-Yield Duration Falling as Well, but No Maturity Wall in Near Term
Similarly, in the high-yield (HY) market, a fall in duration after the start of QT can be observed (figure 2). However, the difference between the HY and IG markets lies in the contribution from different duration buckets. The shorter borrowing nature of HY borrowers is not new, but the 0–5 bucket now contributes more and is the biggest contributor to the overall duration, as compared to the medium-term 5–10 bucket. This can be partly explained by reduced borrowing by HY issuers (figure 4) and letting the existing obligations roll down and become shorter in duration.
Contribution to Mod. Duration - HY
One might be concerned about the refinancing needs of HY borrowers given the current elevated spread and yield environment. This warrants a closer look at the refinancing profile of HY issuers.
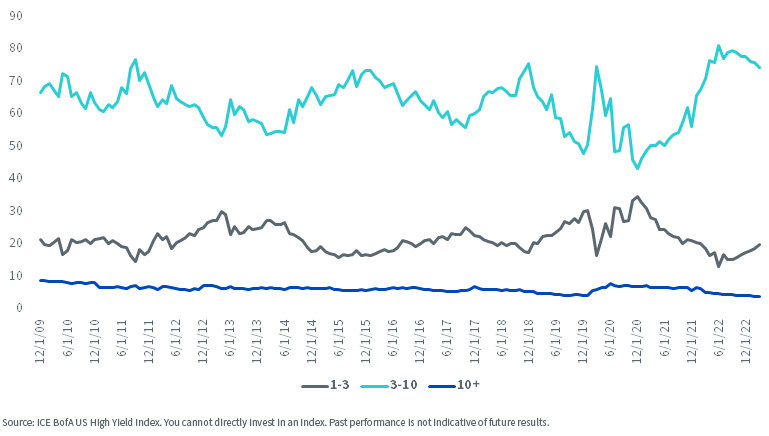
Similar to IG issuers, HY borrowers took advantage of low yield levels after COVID-19 and the flatness of the yield curve after QT to extend the duration profile of their obligations. As can be seen in figure 3, the share of HY borrowers that need to refinance their debt in the next three years has dropped to historically low levels since 2020. On the other hand, the share of longer-term borrowing needs (3–10 years) has increased in the past three years.
Years to Work out
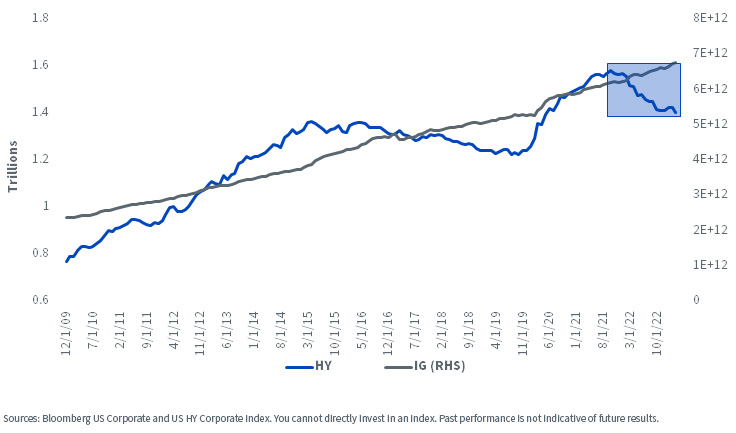
Another important contrast between the IG and HY indexes, as mentioned earlier, is the issuance trends of IG and HY borrowers. HY borrowers reduced the size of their overall debt in the past couple of years, while IG issuance kept its historical pace. All else being equal, this should be a tailwind for HY performance versus IG.
Amount Outstanding
Ratings
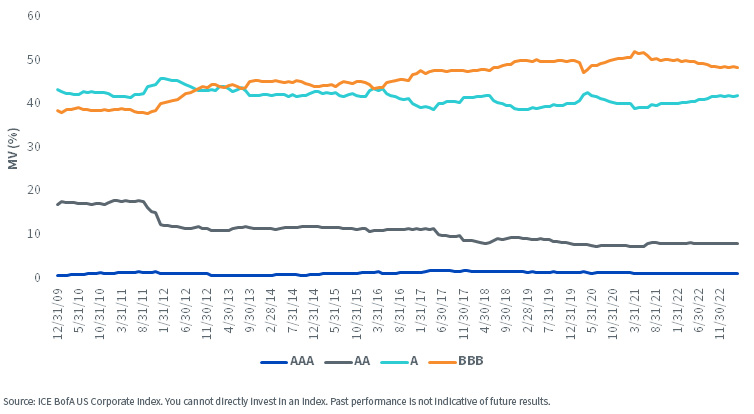
More Investment-Grade Corporates Concentrated in BBBs
The investment-grade index’s quality composition has shifted significantly over the past few decades. While figure 5 reflects changes since the start of 2010, this structural transformation has been in progress for quite some time. Most noticeably, the lower-rated investment-grade borrowers with A and BBB ratings now account for more than 90% of the index, a notable increase from the 77% they represented at the end of 1996. While this shift in creditworthiness is not necessarily a cause for concern, some may view the potential for downgrades into high yield, or “fallen angels,” with unease, depending on their economic outlook and their assessment of where we are in the credit cycle.
IG Quality Breakdown
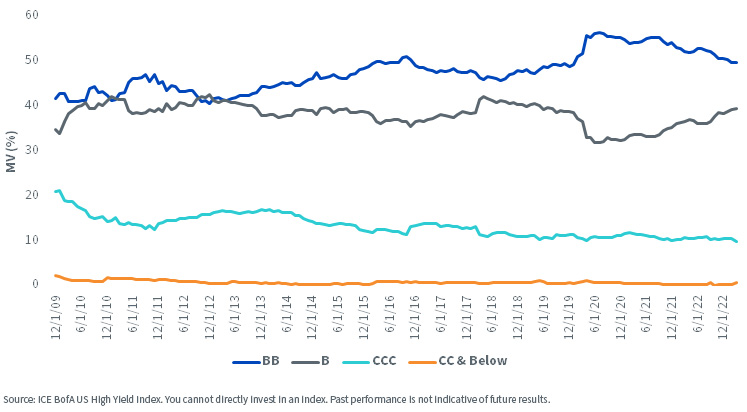
More High-Yield Corporates Concentrated in BBs
In contrast, the HY index’s creditworthiness composition has not experienced material changes over the past 13 years. In fact, the share of the index comprised of higher-quality BB-rated borrowers has increased, with this group now representing more than half of the index.
HG Quality Breakdown
Sectors
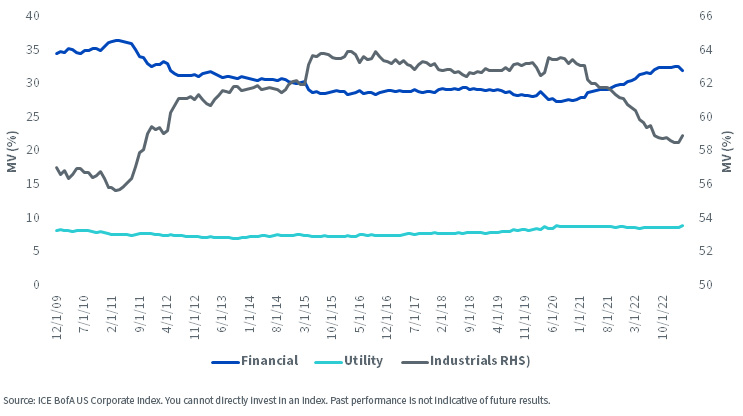
Bigger Financial Presence in Investment Grade
Industrials previously constituted the majority of both investment-grade (IG) and high-yield (HY) indexes (figures 7 & 8). However, Financials became increasingly prominent in IG while remaining relatively stable in HY. Currently, in the IG index, the share of Industrials has fallen below 60% while Financials have risen to levels last seen in the 2000s.
IG Sector Breakdown
HY Sector Breakdown
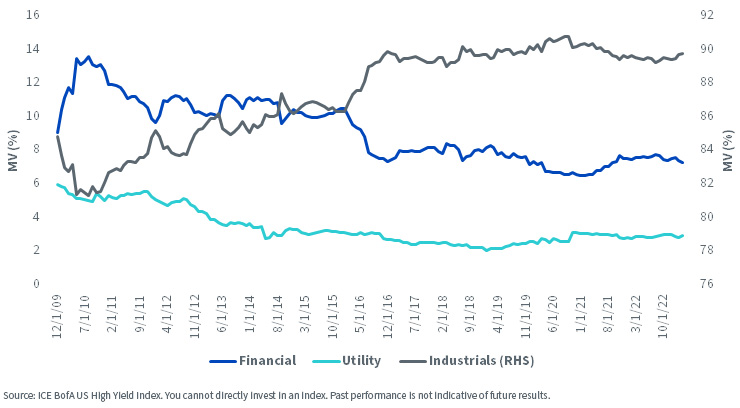
We do not consider the recent failures of banks like SVB and other regional banks to be a systemic risk to the economy or the financial system. Overall, the banks and Financial sector are in a much better position than they were during the global financial crisis. However, higher short-term interest rates and the availability of alternative investment opportunities may lead to a flight of deposits from banks and financial institutions, resulting in lower funding and higher financing costs in terms of interest paid on clients’ deposits. This could adversely affect the net interest income (NII) outlook and profitability of the sector. In light of this, a lower exposure to the Financial sector in HY compared to IG indexes may be advantageous for HY investors.
Conclusion
Since the implementation of quantitative tightening, investors have encountered a challenging investment environment characterized by a heightened correlation between risk assets and limited loss-absorbing capabilities in diversifiers such as fixed income within multi-asset portfolios. Nonetheless, despite lingering risk factors, the fixed income market now offers potential as a source of capital preservation, diversification and higher income. Accordingly, it is important to consider underlying trends and structural shifts in this space.
As previously noted, both investment-grade and high-yield markets present attractive characteristics that should capture investors’ attention. And while recent turmoil in regional banks and concerns about an imminent economic and earnings recession may have caused hesitation among investors to allocate additional capital to these asset classes, specifically to the riskier end of the credit ratings spectrum—namely, HY—it should be noted that these asset classes remain well-positioned to serve as a diversifier and income source within investors’ portfolios.
Share & Comment
Popular Posts
Categories
Related Links
Rick Harper serves as the Chief Investment Officer, Fixed Income and Model Portfolios at WisdomTree Asset Management, where he oversees the firm’s suite of fixed income and currency exchange-traded funds. He is also a voting member of the WisdomTree Model Portfolio Investment Committee and takes a leading role in the management and oversight of the fixed income model allocations. He plays an active role in risk management and oversight within the firm.
Rick has over 29 years investment experience in strategy and portfolio management positions at prominent investment firms. Prior to joining WisdomTree in 2007, Rick held senior level strategist roles with RBC Dain Rauscher, Bank One Capital Markets, ETF Advisors, and Nuveen Investments. At ETF Advisors, he was the portfolio manager and developer of some of the first fixed income exchange-traded funds. His research has been featured in leading periodicals including the Journal of Portfolio Management and the Journal of Indexes. He graduated from Emory University and earned his MBA at Indiana University.