
Quality Dividend Growth Performance Viewed through Venn by Two Sigma


WisdomTree Partnering with Venn by Two Sigma
Big data and analytical tools are burgeoning and becoming more useful to manage portfolios. With this in mind, WisdomTree is excited to partner with Venn by Two Sigma with the goal of bringing even greater insights to investors. But before diving into analysis of quality dividend growth strategies, a good first question is: “What is Venn?”
Venn is a returns-based multi-factor risk analysis platform born out of research from Two Sigma, a leader in financial sciences and quantitative analysis for institutional investors. Venn is cloud-based and helps investment teams with a variety of traditional workflows including proposal generation, performance reporting, portfolio analysis, manager due diligence and scenario analysis.
Venn and WisdomTree both believe technology is a critical tool for investors to streamline workflows while also creating more transparency into portfolio risks. Both companies also believe common factors drive risk and return across and within asset classes. Ultimately, Venn and WisdomTree believe the language of risk factors is an academic-based differentiator to describe and understand your portfolios.
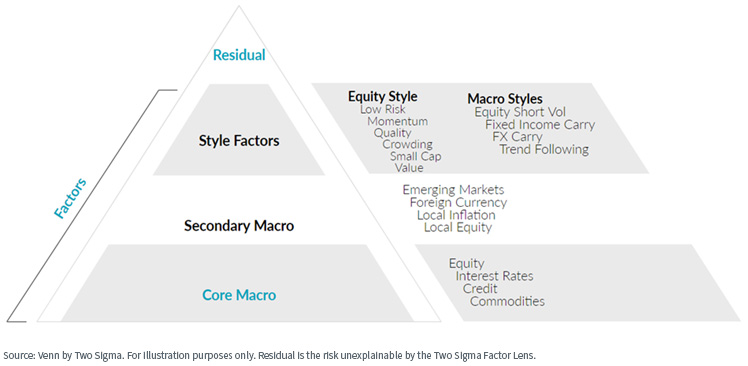
Venn is powered by Two Sigma’s Factor Lens, which is designed to de-compose investment risk and return using equity factors you might know, such as value and quality, but also macro factors such as commodities and interest rates. Venn believes this makes multi-asset portfolio analysis holistic and brings more insight to how individual allocations contribute to overall risk, return or diversification.
Figure 1: The Two Sigma Factor Lens
Measuring the U.S. Quality Dividend Growth Market
Given that quality dividend growth specifically targets the quality factor and aims to be differentiated from the broad market, we thought it would make for an interesting case study for Venn’s analysis.
More specifically, the WisdomTree U.S. Quality Dividend Growth Index (WTDGI) and the WisdomTree U.S. SmallCap Quality Dividend Growth Index (WTSDG) are equity Indexes representing companies WisdomTree believes are best positioned to grow dividends in the future (in the large- and small-cap spaces, respectively). Stock selection focuses on quality dividend payers with attractive measures of profitability and growth.
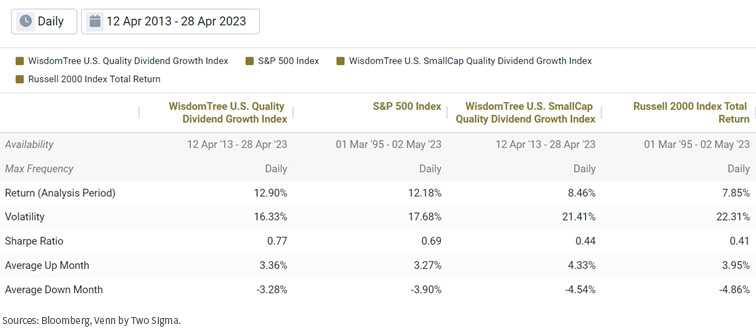
In figure 2, we summarize the top-level results of the two Indexes since their inception in 2013.
Figure 2: Return and Risk for U.S. Dividend Growth Strategies over More Than a Decade
Venn Factor Analysis of Quality Dividend Growth
Running factor analysis relative to benchmarks like the S&P 500 and Russell 2000 helps to isolate the WisdomTree Indexes’ active bets. Figure 3 simplifies the results and shows which of Venn’s 18 factors appear to be most appropriate to describe these bets. Of the selected group, Venn bolds the most relevant factors.
Venn factor analysis suggests that WTDGI had lower equity exposure and higher exposure to low risk, quality, value and small cap than the S&P 500.
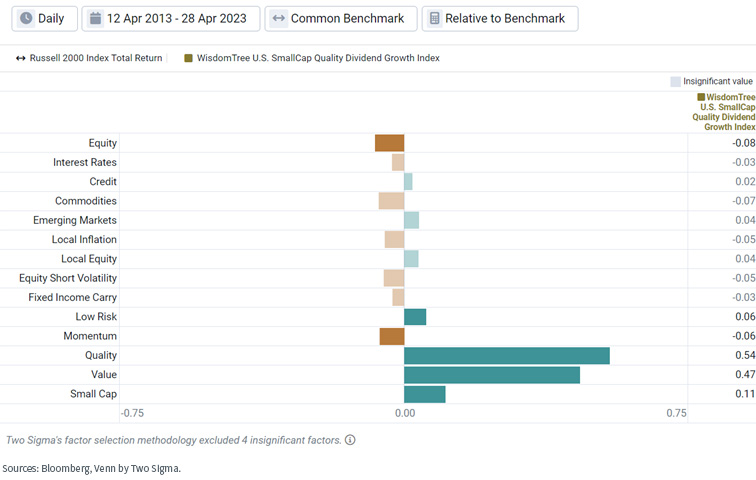
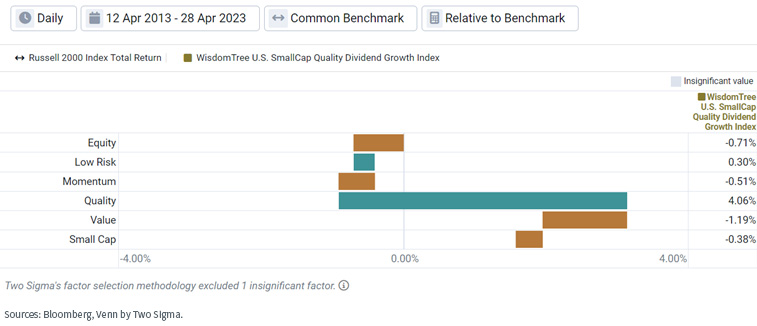
For WTSDG relative to the Russell 2000, Venn shows the same set of factors to be most relevant, with a slight relative negative momentum exposure as well (figure 4).
Figure 3: WisdomTree U.S. Quality Dividend Growth Index Active Factor Exposure Relative to the S&P 500
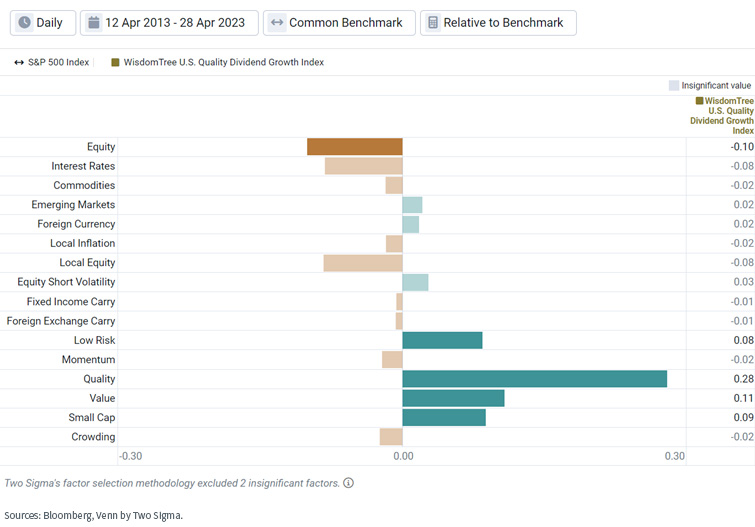
Figure 4: WisdomTree U.S. SmallCap Quality Dividend Growth Index Active Factor Exposure Relative to the Russell 2000
It is reinforcing to see both WTDGI and WTSDG share common risk factors versus their benchmark—demonstrating consistency in how their methodology translates into active exposure, despite being in different capitalization segments of the market. Importantly, the equity style factors they have historically tilted toward have been academically associated with risk premiums, or expected excess returns over time.1
Venn can analyze how these tilts contributed to excess return over each Index's live history, shown in figures 5 and 6.
Figure 5: WisdomTree U.S. Quality Dividend Growth Index Factor Contribution to Return vs the S&P 500
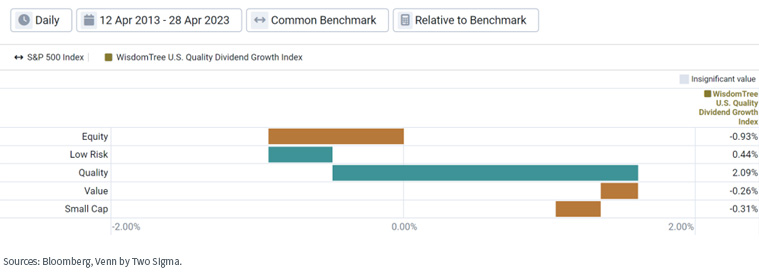
Figure 6: WisdomTree U.S. SmallCap Quality Dividend Growth Index Factor Contribution to Return vs the Russell 2000
Summarizing performance takeaways:
Higher quality: A clear stand out for both Indexes was beneficial performance from having over-weight exposure to quality relative to their benchmarks, adding over 2% and 4% to annualized excess returns, respectively. This outweighed any negative contributions from other factors.
Lower equity and higher low risk: Both Indexes displayed relatively lower equity betas than their market benchmarks over this period. Given the equity risk premium was positive since 2013, it is unsurprising this has detracted from returns. However, relatively higher exposure to the Venn low risk factor was beneficial for both WisdomTree Indexes.
Higher small cap and value: Positive exposure to value and small cap detracted from both Indexes since 2013. In the case of value specifically, this is a testament to the headwinds the value factor faced from May 2014 to October 2020, as it experienced one of its worst and longest drawdowns in history.2 Things looked up for value in 2022, as the value factor was the number one performing factor in the Two Sigma Factor Lens, up more than 25%.
Rolling Periods: Zooming In on the Equity and Quality Factor for Quality Dividend Growth Strategies over Time
Venn also gives us the ability to look at factor trend analysis over rolling periods. Simplifying our analysis, we decided to zoom in on the best and worst active bets for these two Indexes: quality and equity.
Large-Cap U.S. Quality Dividend Growth
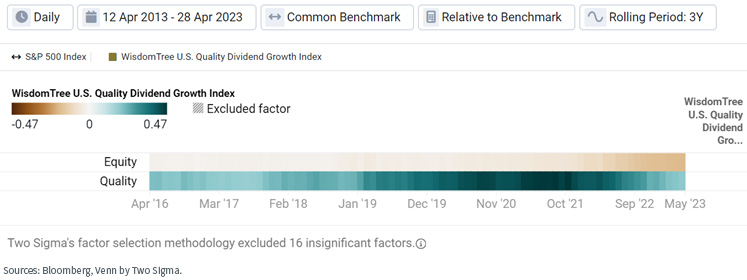
Starting with the large-cap exposure, in figure 7 we looked at rolling three-year analysis and noticed that the difference in equity exposure has actually been quite small historically, picking up more meaningfully recently. Relative quality exposure on the other hand has been strong throughout the Index’s history, becoming even more pronounced around 2019–2021.
Figure 7: Trend Analysis of the WisdomTree U.S. Quality Dividend Growth Index Factor Exposure vs the S&P 500
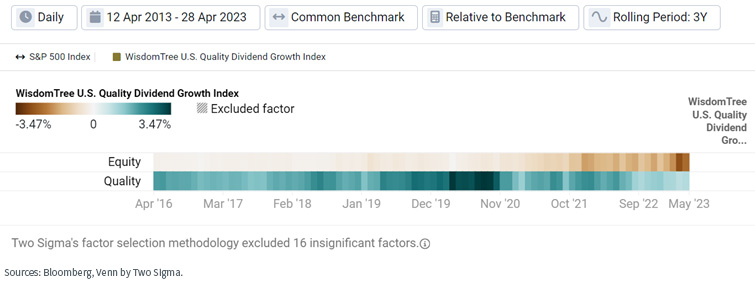
From a return perspective, in figure 8, relatively lower equity exposure for the WisdomTree Index demonstrates a more significant drag on return over the more recent three-year periods. This is likely due to these periods capturing the historic post-COVID rally seen in equity markets in 2020 and 2021.
Quality provided its biggest benefits to WTDGI relative to the S&P 500 around the COVID crash, as investors preferred companies with strong balance sheets. More specifically, in the three-year period ending in March 2020, the month of the COVID crash, WTDGI’s over-weight exposure to quality provided an annualized 3.44% in excess return over the S&P 500.
Figure 8: Trend Analysis of the WisdomTree U.S. Quality Dividend Growth Index Factor Contribution to Return vs the S&P 500
Separate from three-year rolling periods, during the specific crash from February 19 to March 23, 2020, the WisdomTree Index outperformed the S&P 500 by 2.1%, and Venn’s pure quality factor outperformed the S&P 500 by 41.1%. Notably, Venn’s quality factor represents a global long/short beta-neutral portfolio.
Small-Cap U.S. Quality Dividend Growth
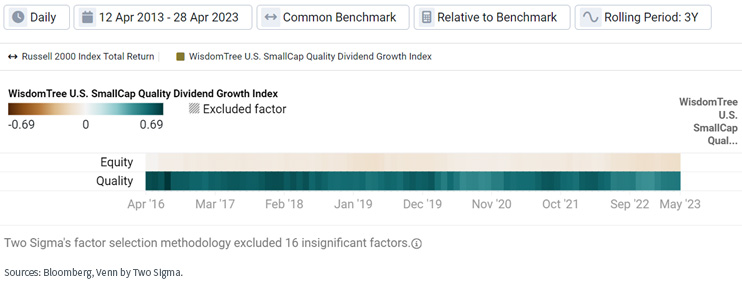
We observed similar relative exposures for WTSDG relative to the Russell 2000 in figure 9, however, with more consistency in terms of only slightly lower equity exposure and much stronger quality exposure. The small-cap Index exhibited its strongest relative quality exposure in the three-year period ending July 2016.
Figure 9: Trend Analysis of the WisdomTree U.S. SmallCap Quality Dividend Growth Index Factor Exposure vs the Russell 2000
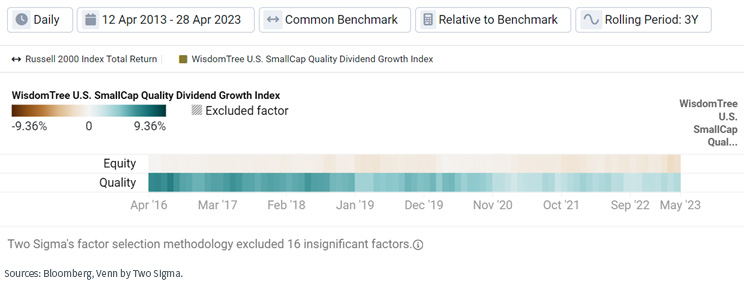
From a return perspective in figure 10, lower equity exposure has been a slight drag on excess returns over time.
For quality, the small-cap Index experienced even larger benefits from its quality tilt than its large-cap cousin, especially around 2016–2018. The largest example of this was the three-year period ending July 2016 (which coincided with its largest exposure difference in quality as well) when quality contributed 6.53% to annualized excess returns versus the Russell 2000 index.
Figure 10: Trend Analysis of the WisdomTree U.S. SmallCap Quality Dividend Growth Index Factor Contribution to Return vs the Russell 2000
Conclusion
Using Venn by Two Sigma, we were able to analyze over a decade of Index performance. Both WisdomTree quality dividend growth Indexes outperformed their market benchmarks with less risk, while exhibiting over-weight exposures to known equity style factors and under-weight exposures to the equity factor. Consistent with their name, the quality over-weight exposure was the largest contributor to excess returns.
Stay tuned for more content from WisdomTree and Venn, helping investors utilize technology in their workflows while helping identify the fundamental drivers of risk.
1 Among many papers on this topic, see Fama, Eugene and French, Kenneth. (1992). “The Cross-Section of Expected Stock Returns.” The Journal of Finance. 47(2). 427-465. Narasimhan Jegadeesh, Sheridan Titman. (1993). “Returns to Buying Winners and Selling Losers: Implications for Stock Market Efficiency.” The Journal of Finance. 48(1). 65-91. Novy-Marx. (2013). “The Other Side of Value: The Gross Profitability Premium.” Journal of Financial Economics. 108(1).1-28. Frazzini, Andrea and Pedersen, Lasse Heje. (2014). “Betting Against Beta.” The Journal of Financial Economics.111.1-25.
2 See Venn by Two Sigma’s 2022 Factor Performance report for more information
Important Risks Related to this Article
Two Sigma Investor Solutions, LP, operates Venn—see here for important disclaimers and disclosures. Venn is for institutional investors only. Christopher Carrano, Vice President of Strategic Research at Venn by Two Sigma, and co-author of this publication, was previously employed by WisdomTree, Inc., from 2015 to 2018.
Share & Comment
Popular Posts
Categories
Related Links
Jeremy Schwartz has served as our Global Chief Investment Officer since November 2021 and leads WisdomTree’s investment strategy team in the construction of WisdomTree’s equity Indexes, quantitative active strategies and multi-asset Model Portfolios. Jeremy joined WisdomTree in May 2005 as a Senior Analyst, adding Deputy Director of Research to his responsibilities in February 2007. He served as Director of Research from October 2008 to October 2018 and as Global Head of Research from November 2018 to November 2021. Before joining WisdomTree, he was a head research assistant for Professor Jeremy Siegel and, in 2022, became his co-author on the sixth edition of the book Stocks for the Long Run. Jeremy is also co-author of the Financial Analysts Journal paper “What Happened to the Original Stocks in the S&P 500?” He received his B.S. in economics from The Wharton School of the University of Pennsylvania and hosts the Wharton Business Radio program Behind the Markets on SiriusXM 132. Jeremy is a member of the CFA Society of Philadelphia.