

As Nvidia’s Market Cap Went from $2 Trillion to $3 Trillion, What Happened with the ETF Exposures?
Key Takeaways
- Nvidia recently reached a new milestone, surpassing $3 trillion in market capitalization.
- There are six ETFs with more than 10% exposure to Nvidia and more than $100 million of AUM: BOTZ, CHAT, SOXX, SMH, FTXL and SOXQ.
- SMH had the highest exposure to Nvidia at 23.35%. We explore the implications in terms of risk and performance.
At WisdomTree, we built our “Thematic Universe” in 2021, which is a way to track the myriad ETFs that we believe to be focused on various thematic topics. Having this database gives us an insight into what types of topics and ETFs U.S. investors are buying and selling.
This monthly report is available here.
In 2024, when we look at Nvidia’s results and share price performance, it feels like we are watching history. In March 2024, we were writing about Nvidia hitting $2 trillion in market capitalization and how certain ETFs had an exposure to this stock greater than 10%.
If we are honest, when we wrote those words that were published on March 15, 2024, we were not expecting to turn around in roughly three months and see Nvidia at a $3 trillion market capitalization. Microsoft and Apple were the only companies to have ever achieved that milestone in the U.S., at least as of that point.1
And yet, not only has Nvidia eclipsed the $3 trillion milestone, but we have also seen:2
- So far in 2024, U.S. investors in thematic ETFs have been placing more than $1 billion per month into ETFs that we group as “semiconductor ETFs” within our thematic universe. As of May 31, 2024, $5.6 billion had been placed into this category on a net basis.
- “Semiconductors” is the largest overall category of thematic topics we track—and we specify more than 40. As of May 31, 2024, nearly $40 billion was in the “Semiconductors” ETFs, and the next largest specific category, sitting closer to $9 billion, was “Cybersecurity” ETFs.
- Even if “Artificial Intelligence & Big Data” is a topic in global focus—and is really a driver for all the interest in Nvidia—this category only had about $4.7 billion of assets as of May 31, 2024.
We wanted to refresh our analysis to show investors the strategies with the biggest exposure to Nvidia, just as we did back in March 2024, especially with the continuation of Nvidia’s run of share price performance.
For this analysis, we sought out U.S. ETFs that, as of May 31, 2024, had:3
- Greater than 10% weight to Nvidia.
- Greater than $100 million in assets under management.
We Found Six ETFs with More than 10% Exposure to Nvidia & More than $100 Million of AUM
- Global X Robotics & Artificial Intelligence ETF (BOTZ): BOTZ seeks to provide investment results that correspond generally to the price and yield performance, before fees and expenses, of the Indxx Global Robotics & Artificial Intelligence Thematic Index. This Index focuses its exposure across four sub-themes: 1) industrial robots and automation, 2) unmanned vehicles and drones, 3) non-industrial robotics and 4) artificial intelligence. Constituents must derive greater than 50% of their revenue from these areas. Weighting is based on modified market capitalization.4
- Roundhill Generative AI & Technology ETF (CHAT): Roundhill believes that generative artificial intelligence will be one of the most impactful technological innovations of the coming decades, driving productivity across the global economy. The Roundhill Generative AI & Technology ETF is the world’s first generative AI ETF. CHAT is actively managed.5
- iShares Semiconductor ETF (SOXX): SOXX seeks to trade the price and yield performance of, before fees and expenses, the NYSE Semiconductor Index. Data prior to June 21, 2021, saw SOXX tracking the total return performance of the PHLX SOX Semiconductor Sector Index. The NYSE Semiconductor Index was formerly named the ICE Semiconductor Index, and it focuses on U.S.-listed semiconductor companies.6
- VanEck Semiconductor ETF (SMH): SMH seeks to replicate, as closely as possible, before fees and expenses, the price and yield performance of the MVIS US Listed Semiconductor 25 Index, which is intended to track the overall performance of companies involved in semiconductor production and equipment. This Index tracks the performance of the 25 largest and most liquid US exchange-listed companies in the semiconductor industry. It is a modified market cap-weighted Index and only includes companies that generate at least 50% of their revenue from semiconductors and semiconductor equipment.7
- First Trust Nasdaq Semiconductor ETF (FTXL): FTXL has an investment objective to seek results that generally correspond to the price and yield, before the Fund’s fees and expenses, of an Index called the Nasdaq US Smart Semiconductor Index. The Index focuses on U.S. companies that are within the “semiconductors” or the “production technology equipment” market segments. For each constituent, a profit score, return on assets score, momentum score and cash flow/book value score are calculated. Weighting is based on cash flows and subject to constraints, such as a maximum constituent weight of 8%.8
- Invesco PHLX Semiconductor ETF (SOXQ): SOXQ is based on the PHLX Semiconductor Sector Index. The Index is designed to measure the performance of the 30 largest U.S.-listed securities of companies engaged in the semiconductor business and includes companies engaged in the design, distribution, manufacture and sale of semiconductors. Reconstitution is annual, whereas rebalancing is quarterly, in March, June, September and December. Weighting is based on modified market capitalization.9
Figure 1 indicates the standardized returns of these six ETFs as of March 31, 2024. A few things become immediately apparent:
- If one looks at the “SMH” rows, the numbers tend to look quite high relative to the others, particularly on a “YTD” and “1-Year” basis, where most of the other Funds also have results.
- “BOTZ” is on the opposite end of the spectrum, tending toward substantially lower observed returns over these different periods.
Figure 1 starts pushing us in a direction where, if we can look under the hood of SMH and BOTZ and understand the differences, it may help us have a greater understanding of the spectrum of returns of these Funds.
Figure 1: Standardized Returns
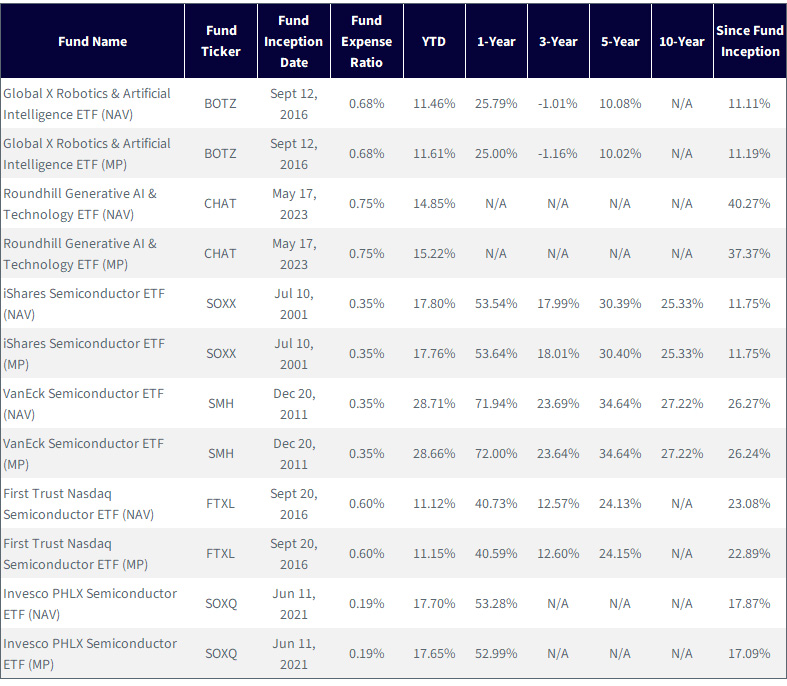
Source: WisdomTree, specifically data from the Fund Comparison Tool in the PATH suite of tools, as of 3/31/24. NAV denotes total return performance
at net asset value. MP denotes market price performance. Past performance is not indicative of future results. Investment return and principal
value of an investment will fluctuate so that an investor’s shares, when redeemed, may be worth more or less than their original cost.
Current performance may be lower or higher than the performance data quoted. For the most recent month-end and standardized
performance and to download the respective Fund prospectuses, click the relevant ticker: BOTZ, CHAT, SOXX, FTXL, SOXQ.
Drumroll…the Top 10
When one does an analysis like this, the “Top 10” is where it becomes visible just how heavily weighted to Nvidia the individual strategies have been. We recognize that since the launch of ChatGPT in November 2022, the maxim “the more weight to Nvidia, the better the return” has been accurate. However, it’s also true that past performance is not indicative of future returns—a sentence you might have seen before peppered throughout any investment literature you’ve ever read.
From a returns perspective, it is globally known that Nvidia has been incredible. Any knowledge we assemble from this point has to be aimed toward increasing our understanding of what may happen in the future.
In figure 2:
- SMH had an exposure to Nvidia of 23.35% as of May 31, 2024. No other strategy eclipsed 20%. The next largest exposure was SOXQ, at 15.3%.
- SOXX and FTXL had the lowest exposures to Nvidia, each around 10.3%.
- BOTZ was on the lower end of the spectrum, with only 11.3% in Nvidia.
It is, therefore, clear that SMH’s superior results may have been helped by a substantially greater weight to Nvidia during a time when this stock was at a historic share price run. It is not yet clear why BOTZ has tended to trail significantly on a returns basis relative to SOXX and FTXL, which also had lower Nvidia weights.
Figure 2: The Top 10 Exposures

Sources: WisdomTree, FactSet, as of 5/31/24. Holdings subject to change. For the most recent month-end standardized performance and to
download the respective Fund prospectuses, please visit the respective sponsor websites and Fund home pages. For the most recent
month-end and standardized performance and to download the respective Fund prospectuses, click the relevant ticker: BOTZ, CHAT, SOXX,
FTXL, SOXQ.
A Similarity Heat Map
As we look at these strategies in figure 2, the word “concentration” cannot be far from one’s mind. The lowest combined weight in the top 10 was CHAT, at 52.44%. The highest overall weight in the top 10 was SMH, at 74.10%. Most were clustered between 58% and 64% of weight in the top 10.
With this much weight in the top 10, if we can indicate a measure of how many strategies have the same stocks in the top 10, we get a summary view of how similar they might be, at least on a holdings basis. That is what we seek to do in figure 3:
- All six of the strategies have Nvidia in the top spot—this was by design. Six is, therefore, the highest number one can see in this table.
- BOTZ had nine positions that were in none of the other Funds shown here—in a sense, it was the most “different” of the strategies shown. It is actually tracking an index that includes a focus on robotics in quite a specific way—a focus that none of the other strategies emphasize as clearly within their top 10. In recent years, robotics has not been as strong in generating returns as AI and semiconductors have, so it starts to become clearer why BOTZ has been the relative laggard in terms of the returns that we saw in figure 1.
- CHAT had seven positions that were not included in any of the other strategies shown here. This is an active ETF focused primarily on “generative AI,” which is a lot more software- and cloud-computing-focused than semiconductor-focused.
- SOXX, SMH, FTXL and SOXQ are all more directly focused on semiconductors and appear highly similar. The primary differences, besides the weighting, are apparent more on the margins, where one can include semiconductor equipment companies (ASML and Lam Research as two examples), or they can tilt away from these. We were surprised how all four did not have Taiwan Semiconductor Manufacturing Co. (TSMC) right in the top 10, given the company’s importance to global semiconductors—but this is an example of a great question to pose when peering under the hood of these strategies.
Figure 3: The Top 10 Similarity Heat Map

Sources: WisdomTree, FactSet, as of 5/31/24. Holdings subject to change. For the most recent month-end standardized performance and to
download the respective Fund prospectuses, please visit the respective sponsor websites and Fund home pages. For the most recent
month-end and standardized performance and to download the respective Fund prospectuses, click the relevant ticker: BOTZ, CHAT,
SOXX, FTXL, SOXQ.
Finally, we can discuss the bottom-line, year-to-date 2024 performance through June 14, 2024. When many people are contemplating allocations at the year’s halfway mark, they might be looking at metrics such as this. We’d note in figure 4:
- When one sees SMH as the top performer—by a significant margin—one must combine this with the knowledge that we showed in figure 2, that SMH has more than 23% in Nvidia. So far in 2024, this has been additive for returns as Nvidia’s share price performance has been incredible. However, if Nvidia’s share price return begins to falter, this strategy could be quite exposed.
- BOTZ, the laggard, is providing exposure to robotics—an area that the other strategies in this piece are not as directly focused on. Robotics has not been the route to the strongest possible performance so far in 2024, but we’d note that there are cases to be made where robotics could be the next leg of the AI euphoria that we have seen for nearly two years.
- FTXL is tracking an index that is not market capitalization-weighted, but rather, it is weighting companies based on a composite of different factors. So far in 2024, the market has been mostly driven by the mantra “bigger is better,” with the “bigger” referring to the market capitalization size and the “better” referring to better returns. However, this can shift, and at WisdomTree, we frequently do not place the biggest weights in the biggest companies, so we understand this approach.
Figure 4: Year-to-Date Returns

Source: WisdomTree, specifically data from the Fund Comparison Tool in the PATH suite of tools, for the period 1/1/24 to 6/14/24. NAV denotes
total return performance at net asset value. MP denotes market price performance. Past performance is not indicative of future results.
Investment return and principal value of an investment will fluctuate so that an investor’s shares, when redeemed, may be worth
more or less than their original cost. Current performance may be lower or higher than the performance data quoted. For the most
recent month-end standardized performance and to download the respective Fund prospectuses, please visit the respective sponsor
websites and Fund home pages. For the most recent month-end and standardized performance and to download the respective Fund
prospectuses, click the relevant ticker: BOTZ, CHAT, SOXX, FTXL, SOXQ.
Conclusion: Does It Make Sense to Chase Nvidia in June 2024?
We find it important to always ask this question with reference to the present period—June 2024 as we write these words—because if you are making decisions, you can only do so in the present. We all know that it WAS a great move, returns-wise, to maximize exposure to Nvidia from roughly late November 2022 to June 2024, but this doesn’t help us in deciding what to do over the next 18 or so months.
Some might be wondering—where is the WisdomTree strategy? Well, when we rebalanced the WisdomTree Artificial Intelligence & Innovation Index, which is tracked by the WisdomTree Artificial Intelligence & Innovation Fund (WTAI), we only allocated 2.3% weight to Nvidia in May 2024.10 The lowest weights to Nvidia that we saw within the six strategies in this piece were about 8% higher. WTAI is designed with a diversified exposure to a broad AI ecosystem in mind, so the strategy cannot place undue weight in any one company, and furthermore, it can be difficult to jump onto a momentum train 18 months into a rally.
So far, not placing more weight to Nvidia has detracted from relative returns, but we remind investors that the AI story, if it really works, is a 10- to 15-year journey that will not be fully known by the end of 2024 or even in 2025. We expect a lot of topics to come into and fade out of prominence, so we believe in more of a broad-based approach for the coming years.
Figure 5a: Other Important Information

Figure 5b: Other Important Information

Source: WisdomTree, specifically the Fund Compare Tool, with data quoted as the most recently available as of 6/16/24. Due to certain complexities of
fundamental aggregation, the Price-to-Sales, Price-to-Book, Price-to-Cash-Flow, Estimated (Est.) Price-to-Earnings and Est. Price-to-Earnings (excludes
firms with negative earnings) Ratios and % of Firms with Negative Earnings Statistics are as of 5/31/24. Total Expense Ratio and Total Assets Under
Management are current as of 6/14/24 (most recent market close as of 6/16/24), with these measures taken from specific Fund websites.
If you are interested in diving more into the comparison of these Funds, please check out our Fund Comparison Tool.
1 Source: Anita Hamilton and Adam Clark, “Nvidia Reaches $3 Trillion Market Value. It’s the Latest Sign of Chip Demand,” Barron’s, 6/5/24.
2 Sources: WisdomTree, Morningstar, Bloomberg. All data as of 5/31/24 and based on WisdomTree’s internal classification of thematic funds. Performance is based on monthly returns from Bloomberg and Morningstar. Historical performance is not an indication of future performance, and any investments may go down in value.
3 Sources: WisdomTree, FactSet, with data as of 5/31/24.
4 Sources: Global X, Indxx Global Robotics & Artificial Intelligence Thematic Index Methodology document, January 2023 update.
5 Source: Roundhill Investments, accessed on 6/16/24.
7 Sources: VanEck, Market Vector MVIS US Listed Semiconductor 25 Index Guidebook, May 2024 Update.
8 Sources: First Trust, Nasdaq US Smart Sector Index methodology document, 2023 Update.
9 Sources: Invesco, PHLX Semiconductor Sector Index methodology, 2024 Update.
10 New portfolio positions in WTAI and the WisdomTree Artificial Intelligence & Innovation Index took effect after the close on May 17, 2024, and began trading at the open on May 20, 2024.
Related Products


Important Risks Related to this Article
For current holdings of WTAI, please click here. Holdings are subject to risk and change.
There are risks associated with investing, including the possible loss of principal. The Fund invests in companies primarily involved in the investment theme of artificial intelligence (AI) and innovation. Companies engaged in AI typically face intense competition and potentially rapid product obsolescence. These companies are also heavily dependent on intellectual property rights and may be adversely affected by loss or impairment of those rights. Additionally, AI companies typically invest significant amounts of spending on research and development, and there is no guarantee that the products or services produced by these companies will be successful. Companies that are capitalizing on innovation and developing technologies to displace older technologies or create new markets may not be successful. The Fund invests in the securities included in, or representative of, its Index regardless of their investment merit, and the Fund does not attempt to outperform its Index or take defensive positions in declining markets. The composition of the Index is governed by an Index Committee, and the Index may not perform as intended. Please read the Fund’s prospectus for specific details regarding the Fund’s risk profile.