
A Silver Lining of Dollar Weakness? Potential Earnings Growth
Published August 6, 2025

Associate, Investment Strategy
Key Takeaways
- The U.S. dollar’s sharp 9% decline in the first half of 2025—its worst since the global financial crisis—has significantly boosted returns for international equities and set the stage for a rebound in U.S. corporate earnings.
- While economic concerns tied to new tariffs have weakened traditional rate-driven support for the dollar, the downturn may enhance earnings from large-cap U.S. multinationals with global exposure.
- Historically, steep dollar sell-offs like 2025’s have preceded double-digit earnings growth for the S&P 500, supporting a bullish near-term outlook for equity markets heading into late 2025 and early 2026
2025 has been historically turbulent for the dollar, with declines of a magnitude last observed during the global financial crisis (GFC).
The Bloomberg U.S. Dollar Index's (BBDXY) 9% nosedive through the first half of the year noticeably enhanced returns for non-U.S. indexes and contributed about 50% of the year-to-date (YTD) gains across developed markets, on average.
Figure 1: Returns
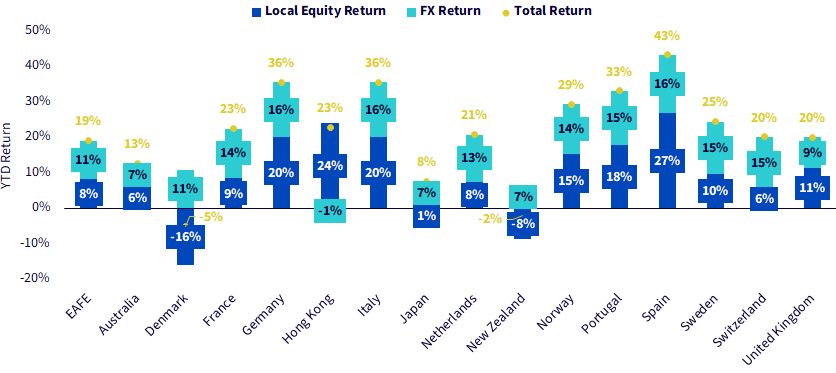
Sources: WisdomTree, MSCI, as of 7/14/25. Past performance is not indicative of future results. You cannot invest directly in an index. Performance for countries shown is represented by the corresponding MSCI equity index, e.g., EAFE = MSCI EAFE Index.
But What Exactly Has Caused the Dollar to Collapse This Year?
Recently, economic growth concerns resulting from President Trump's unpredictable tariff agenda and vague implementation schedule have been imposing immense pressure on the dollar. These effects are overpowering many of its traditional, short-term, directional influences, such as interest rate differentials.
For much of the post-pandemic environment, the dollar was closely correlated with U.S. short-term rates for directional guidance. As U.S. rates steadily exceeded those in other developed economies by wider margins, the dollar strengthened against the currency bearing the lower rate. When the spread between U.S. and developed market interest rates narrowed, the dollar consequently weakened.
This was most visible in the EUR/USD exchange rate over the past few years. Using the German 2-Year bund yield as a proxy for eurozone monetary policy rates, the exchange rate closely tracked the yield spread (outside of a spring 2023 aberration). When spreads widened, U.S. Treasuries offered comparatively more income over bunds, leading to dollar appreciation over the euro, and vice versa.
Figure 2: EUR/USD vs. U.S.-Germany 2-Year Yield Spread

Sources: WisdomTree, FactSet, Bloomberg, as of 7/15/25.
But "Liberation Day" drastically decoupled the relationship and diverged the two, with economic growth concerns from the tariff fallout newly dominating interest rate effects as the superior influence. Spreads between the U.S. and German 2-Year sovereign bonds remained relatively stable, yet the euro strengthened nearly 7% versus the dollar in the Liberation Day aftermath.1
Without question, it's been a difficult year for the dollar, and its near-term outlook seems equally dour.
However, dollar weakness is not always universally painful for U.S. investors. Ironically, its worst periods often provide direct, auxiliary support to domestic equity markets, and some of its most notable benefits may be forthcoming.
Dollar Weakness Energizes Corporate Earnings
The six-month decline in BBDXY ranks as the fourth-worst selloff in the past two decades. Only three 6-month declines during the depths of the GFC in 2009 surpassed 2025's downturn.
Figure 3: Top 10 Worst Six-Month Declines in BBDXY over the Past 20 Years

Sources: WisdomTree, Bloomberg, as of 6/30/25. Past performance is not indicative of future results. You cannot invest directly in an index. Dates shown represent the performance over the six-month period ending at that date, e.g., Aug. 2009 represents 2/28/09 through 8/31/09.
The magnitude of this decline is certainly significant, but we think its implications for near-term earnings are even greater for another reason. Our research has shown that a weak dollar has historically provided impressive tailwinds for earnings growth from large, multinational U.S. companies.
In other words, those who stand to benefit the most from a weaker dollar may be U.S. equity investors themselves.
Figure 4: Dollar Fluctuations Have Implications for S&P 500 Earnings
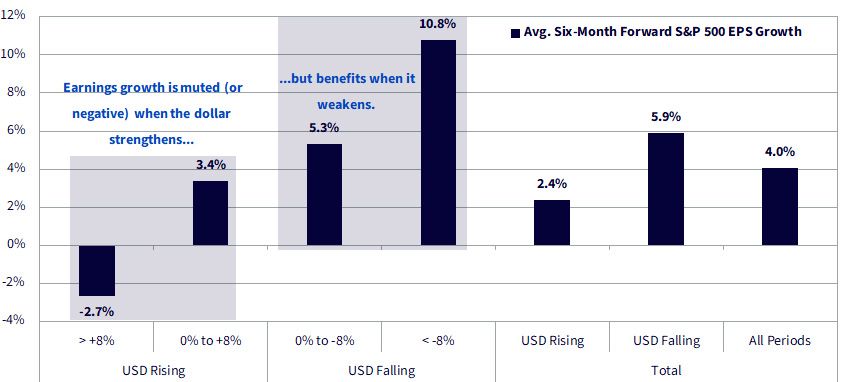
Sources: WisdomTree, FactSet, S&P, as of 6/30/25. Data points in the chart represent 12/31/1994 through 11/30/2024, because 12/31/24 is the most recent date for which we can calculate six-month forward (6/30/25) earnings per share (EPS) growth for the S&P 500. You cannot invest directly in an index. Past performance is not indicative of future results.
When the dollar weakened over any given six-month interval, S&P 500 earnings historically grew nearly 6%, on average, in the subsequent six months. This is nearly 2% greater than the 4% average growth observed across all periods of strengthening and weakening in our data history.
But sharp declines, such as the 9% plummet observed year-to-date, exhibited more pronounced effects. They corresponded to double-digit average earnings growth in the following six months, which is more than double the average growth across all regimes and nearly 5% greater than the average gain during all depreciation periods.
If this relationship holds through 2025, large-cap U.S. multinationals may deliver impressive results during the Q3 and Q4 2025 earnings seasons. Barring a reversal in the next few months, potential earnings strength may extend into 2026 as well. Q2 earnings season is beginning as we write, and we anticipate several company announcements will include favorable guidance comments about the impacts of dollar weakness on earnings toward the end of the year.
The earnings growth trend persisted over the prior 20 steepest declines as well. Earnings in the subsequent six months only declined six times, while four other observations exhibited below-average (4%), yet positive, growth. The remaining 10 observations produced above-average growth, with eight of them recording double-digit gains.
Figure 5: Top 20 Worst Six-Month Declines in BBXY over the Past 20 Years vs. Six-Month Forward S&P 500 EPS Growth
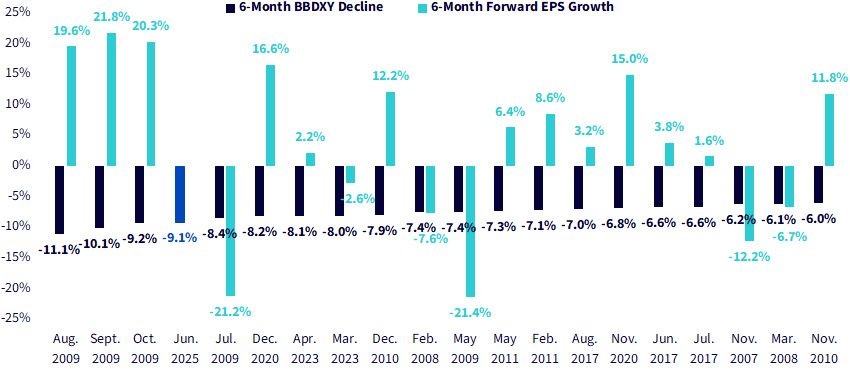
Sources: WisdomTree, Bloomberg, as of 6/30/25. Past performance is not indicative of future results. You cannot invest directly in an index. BBDXY decline dates represent the performance over the six-month period ending on that date, e.g., Aug. 2009 represents 2/28/09 through 8/31/09. Forward EPS growth dates represent the performance over the six-month period beginning on that date, e.g., Aug. 2009 represents earnings growth from 8/31/09 through 2/28/10.
Based on this trend, we think there may be a reason to believe that earnings results toward the end of this year may surprise to the upside and persist into 2026. Because earnings are the fundamental engine of equity markets, the weaker dollar's relationship to earnings is one of our key tenets supporting our bullish outlook for equities over the near term.
Categories
About the contributor

Associate, Investment Strategy
Brian Manby joined WisdomTree in October 2018 as an Investment Strategy Analyst. He is responsible for assisting in the creation and analysis of WisdomTree’s model portfolios, as well as helping support the firm’s research efforts. Prior to joining WisdomTree, he worked for FactSet Research Systems, Inc. as a Senior Consultant, where he assisted clients in the creation, maintenance and support of FactSet products in the investment management workflow. Brian received a B.A. as a dual major in Economics and Political Science from the University of Connecticut in 2016. He is holder of the Chartered Financial Analyst designation.