

A Tale of Two Yield Curves
Published April 19, 2023

Kevin Flanagan
Head of Investment and Fixed Income Strategy
Remember when inverted Treasury (UST) yield curves were all the rage? Not that long ago, there was a plethora of stories “hitting the tape” about this development, and with it, the conjecture quotient rose regarding when the U.S. economy would enter into a recession.
Well, investors are still waiting for signs of that recession. Certainly, some of the recent economic data that has been released is beginning to show increasing evidence that activity does appear to be slowing. And when you add the tighter lending conditions that are also becoming more readily apparent, you do get the feeling that it has now become not a matter of if, but just when, real GDP will enter into negative territory.
With respect to the yield curve’s predictive value, if you’re keeping track, the two most closely followed measures, the UST 2-Yr/10-Yr and UST 3-Mo/10-yr gauges, went into inverted or negative territory in July and October/November of last year, respectively. So, if history is any guide, the shot clock does seem to be ticking.
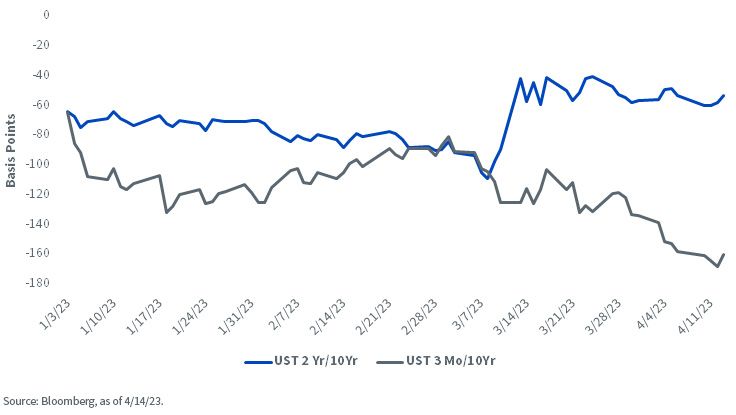
U.S. Treasury Yield Curves
However, in this blog post, I didn’t necessarily want to discuss the prospect of what is perhaps the most widely anticipated recession in my career, but rather, bring the reader up to date on the state of the two aforementioned yield curves.
With respect to the UST 3mo/10yr measure, the inversion has still been gathering steam. To provide some perspective, the negative differential has gone from roughly -50 basis points (bps) to end 2022 to expand to -160 bps as of this writing. Also, compare this to a year ago, when the spread was a positive +200 bps. The more interesting part of this discussion is what has transpired to the UST 2yr/10yr gauge. Yes, it is still firmly in negative territory, but this curve has actually steepened of late. On March 8, pre-Silicon Valley Bank (SVB), the inversion reached its peak of -109 bps, but since then, the negative differential has been essentially cut in half to -53 bps. Meanwhile, for the UST 3mo/10yr, the inversion has increased by about 55 bps.
What’s behind this divergent behavior? Well, obviously, the UST 10-Year aspect of both curves is a constant force, so the answer lies in the different yield activity between the 3-Month t-bill and the UST 2-Year note. For the former, the yield has remained just under 5%, but for the 2-Year, the yield has plunged about 100 bps during the last five weeks or so. While the 3-Month t-bill has been tethered to the Fed Funds trading range, the 2-Year yield has fallen for two key reasons: the changing Fed outlook, where rate cut expectations have increased, and inflows coming in from either a safe haven status or attempts to lock in yields before any Fed reversal.
Conclusion
For fixed income investors, the continued inverted shape of the yield curve plays into the notion that I’d still rather be “late than early” to the duration party.
Categories
Related articles
‘Warsh’ and Dry

What’s ‘Under the Hood’ of Your Core Bond Position?

Powell Stays…Should the Dot Plot?

Fed Watch: Powell’s Last Stand & What Comes Next?
Inflation’s First Official Debut
Nowhere to Hide…Except Maybe Treasury Floating Rate Notes
How to Mitigate Software Exposure in Bonds
Fed Watch: Between a Rock and a Hard Place
One Week Later
About the contributor

Kevin Flanagan
Head of Investment and Fixed Income Strategy
Kevin serves as the Head of Investment and Fixed Income Strategy. In this role, he writes macro and fixed income-related content and works closely with the sales, research and marketing teams. In addition, Kevin conducts client-facing webinars and meetings, providing expertise on WisdomTree’s existing and future bond ETFs. Prior to joining WisdomTree, Kevin spent 30 years at Morgan Stanley, where he was Managing Director and Chief Fixed Income Strategist for Wealth Management. He was responsible for tactical and strategic recommendations and created asset allocation models for fixed income securities. He was a contributor to the Morgan Stanley Wealth Management Global Investment Committee, primary author of Morgan Stanley Wealth Management’s monthly and weekly fixed income publications, and collaborated with the firm’s Research and Consulting Group Divisions to build ETF and fund manager asset allocation models. Kevin has an MBA from Pace University’s Lubin Graduate School of Business, and a B.S. in Finance from Fairfield University.