DXJ
Japan Hedged Equity Fund

Published November 5, 2024

Global Head of Research
Do you remember August 5, 20241?
How about September 24, 20242?
For investors focused on global equities, these were very important days.
Days like these remind us how dramatic equity market moves can be, and it’s interesting to see the path of returns following these massive moves.
WisdomTree has strategies that were directly impacted by these moves:
It is interesting to place the massive aforementioned moves of these markets into better context, which may then allow clearer assessment of the market opportunity offered by each strategy at present.
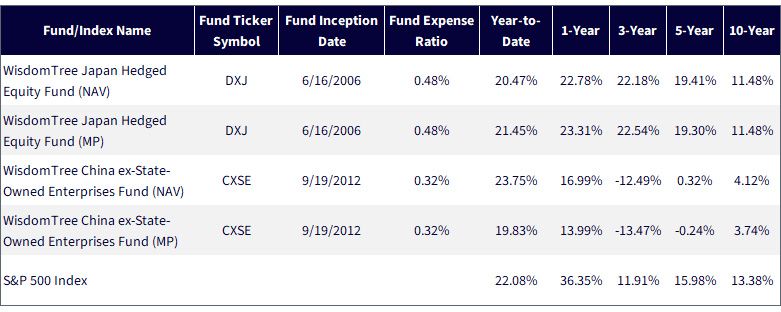
Sources: LSEG, FactSet and WisdomTree, specifically data is from the PATH Fund Comparison Tool, as of 9/30/24. NAV denotes total return
performance at net asset value. MP denotes market price performance. You cannot invest directly in an index. Past performance is not indicative
of future results. Investment return and principal value of an investment will fluctuate so that an investor’s shares, when redeemed,
may be worth more or less than their original cost. Current performance may be lower or higher than the performance data quoted.
For the most recent month-end and standardized performance, click the relevant ticker: DXJ, CXSE.
We noticed a lot of investor excitement around Japan during the first seven months of 2024. Then, with one communication regarding the possible path of future policy rate moves at the Bank of Japan, everything changed. August 5, 2024, is a day that any Japan-focused investor will remember.
In figure 2, we see that the NAV return of DXJ went from above 30% all the way back to being slightly negative because of this downdraft.
Now, Japan’s policy makers have retracted the intention behind those statements and it’s interesting that the year-to-date 2024 returns, through nearly the end of October, have largely recovered.3
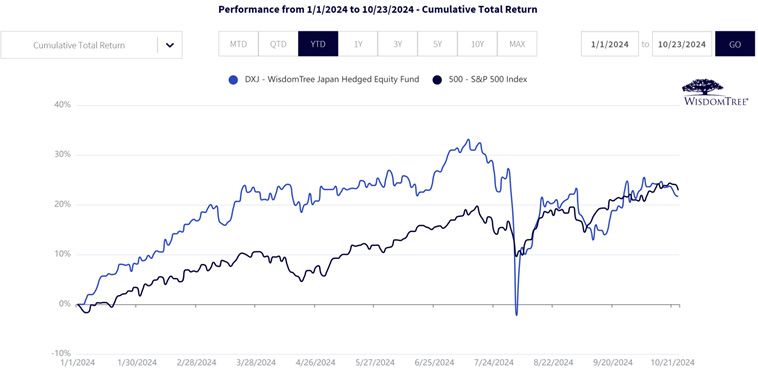
Sources: LSEG, FactSet and WisdomTree, specifically data is from the PATH Fund Comparison Tool, accessed as of 10/24/24. NAV denotes
total return performance at net asset value. MP denotes market price performance. You cannot invest directly in an index. Past performance
is not indicative of future results. Investment return and principal value of an investment will fluctuate so that an investor’s shares,
when redeemed, may be worth more or less than their original cost. Current performance may be lower or higher than the
performance data quoted. For the most recent month-end and standardized performance click here.
CXSE's 2024 experience was quite different. For nearly the first three-quarters of 2024, sentiment surrounding China’s equity market returns was terrible. We see that CXSE's year-to-date return was negative for most of this period.
Then, on September 24, 2024, China’s government announced a plan for stimulus, and we saw CXSE enter a period that ultimately led from returns that were negative on a year-to-date 2024 basis all the way to, at a certain point, being better than 30% on a year-to-date basis. Through the end of October, there was some degree of correction, but the year-to-date figure is still close to 20%.
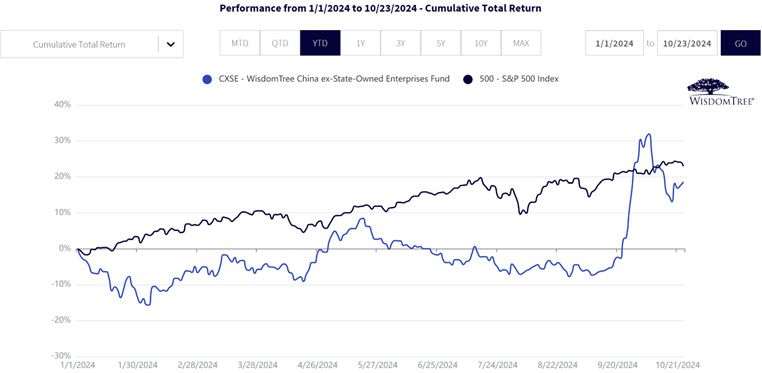
Sources: LSEG, FactSet and WisdomTree, specifically data is from the PATH Fund Comparison Tool, accessed as of 10/24/24. NAV denotes
total return performance at net asset value. MP denotes market price performance. You cannot invest directly in an index. Past performance
is not indicative of future results. Investment return and principal value of an investment will fluctuate so that an investor’s shares,
when redeemed, may be worth more or less than their original cost. Current performance may be lower or higher than the
performance data quoted. For the most recent month-end and standardized performance clickhere.
There is a certain familiarity among U.S. investors with the S&P 500 Index benchmark. During 2024, this benchmark has been far more stable, trending mostly in an upward direction, than either DXJ or CXSE.
But what about over longer, standardized periods?
For us, China conforms to expectations. CXSE has a pretty good year-to-date and one-year return, but much rougher three-year and five-year figures. People believe that China has been volatile, and that is exactly what we see.
Japan is a bit of a surprise. We believe that few would expect to see the stability of the double-digit returns that DXJ has delivered on a three-, five- and 10-year basis. DXJ is certainly not without volatility, but most people are so familiar with the strength of U.S. equities and the S&P 500 Index benchmark returns that they would assume that international markets could not compare—and DXJ proves them wrong over some of these periods.
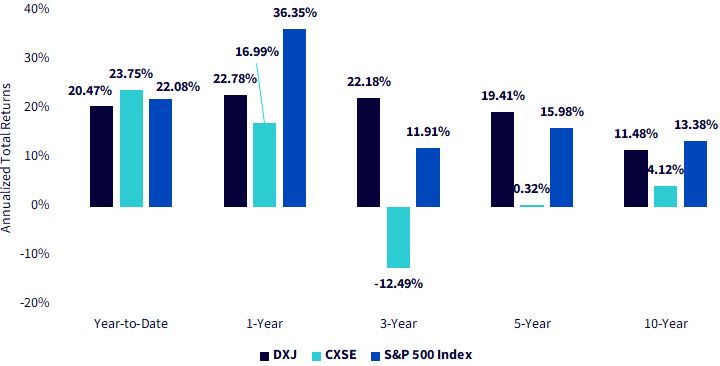
Sources: LSEG, FactSet and WisdomTree, specifically data is from the PATH Fund Comparison Tool, as of 9/30/24. NAV denotes total
return performance at net asset value. MP denotes market price performance. You cannot invest directly in an index. Past performance
is not indicative of future results. Investment return and principal value of an investment will fluctuate so that an investor’s
shares, when redeemed, may be worth more or less than their original cost. Current performance may be lower or higher
than the performance data quoted. For the most recent month-end and standardized performance, click the relevant ticker:
DXJ, CXSE.
If we think of our understanding of what is happening in these respective markets:
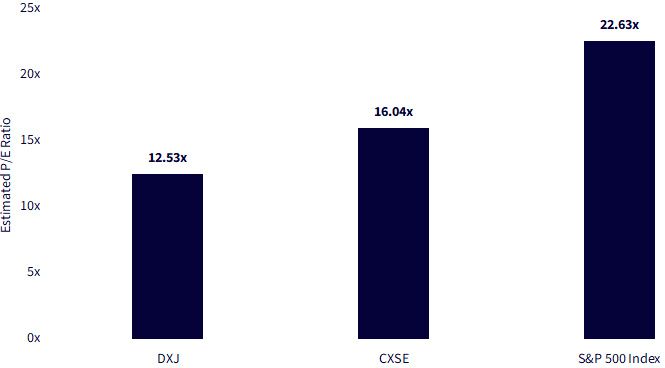
Now, we remind everyone that one of the most critical considerations regards how a market is priced. People intuitively see this with a company like Nvidia all the time. The reason why the share price has continued to increase is that with each new bit of news, there is a perception that the results are even better and even stronger than what is currently reflected. It is similar for baskets of stocks. When we see the S&P 500 Index at an estimated price-to-earnings (P/E) ratio at about 22.6 times, that’s telling us that the market’s valuation is high relative to history—but not so high that an immediate correction should be on the horizon. During what we now know of as the Tech Bubble in 2000, this figure was above 30.0 times.6
However, for all of DXJ's performance that we have reviewed in this piece, this group of stocks is still trading at a 12.53-times estimated P/E ratio. Over one, three, five and 10 years, DXJ outperformed CXSE, and this valuation measure is still lower. Additionally, Japan’s equity market does not have the same degree of government policy risk that is currently perceived in China.
Sources: LSEG, FactSet and WisdomTree, specifically data is from the PATH Fund Comparison Tool, as of 9/30/24. NAV denotes
total return performance at net asset value. MP denotes market price performance. You cannot invest directly in an index.
Past performance is not indicative of future results. Investment return and principal value of an investment will
fluctuate so that an investor’s shares, when redeemed, may be worth more or less than their original cost. Current
performance may be lower or higher than the performance data quoted. For the most recent month-end and
standardized performance, click the relevant ticker:DXJ, CXSE.
1 Source: Amanda Cooper, “Markets Give Off 'Black Monday' Vibes As Stocks Tank,” Reuters, 8/5/24.
2 Source: Sam Goldfarb & Chelsea Dulaney, “Stock Market News, Sept. 24, 2024: Indexes Climb; Chinese Shares Surge on Stimulus Blitz,” Wall Street Journal, 9/24/24.
3 Source: Toru Fujioka, “BOJ Board Member Urges Slow Approach to Interest Rate Hikes,” Yahoo Finance, 10/16/24.
4 Source: Hideyuki Sano & Yasufumi Saito, “Better Corporate Governance in Japan Pays Off for Investors,” Bloomberg, 5/8/24.
5 Source: Donny Kwok & Scott Murdoch, “Beijing’s Regulatory Crackdown Wipes $1.1 trillion off Chinese Big Tech,” Reuters, 7/12/23.
6 Source: https://www.wisdomtree.com/-/media/us-media-files/documents/resource-library/daily-dashboard.pdf
There are risks associated with investing, including the possible loss of principal. Please read the Fund’s prospectus for specific details regarding the Fund’s risk profile. Foreign investing involves special risks, such as risk of loss from currency fluctuation or political or economic uncertainty.
DXJ: The Fund focuses its investments in Japan, thereby increasing the impact of events and developments in Japan that can adversely affect performance. Investments in currency involve additional special risks, such as credit risk and interest rate fluctuations, as well as derivative investments, which can be volatile and may be less liquid than other securities, and more sensitive to the effect of varied economic conditions. As this Fund can have a high concentration in some issuers, the Fund can be adversely impacted by changes affecting those issuers. Due to the investment strategy of this Fund it may make higher capital gain distributions than other ETFs. Dividends are not guaranteed, and a company currently paying dividends may cease paying dividends at any time.
CXSE: The Fund focuses its investments in China, including A-shares, which include the risk of the Stock Connect program, thereby increasing the impact of events and developments associated with the region which can adversely affect performance. Investments in emerging or offshore markets are generally less liquid and less efficient than investments in developed markets and are subject to additional risks, such as risks of adverse governmental regulation and intervention or political developments. The Fund’s exposure to certain sectors may increase its vulnerability to any single economic or regulatory development related to such sector. As this Fund can have a high concentration in some issuers, the Fund can be adversely impacted by changes affecting those issuers.

Global Head of Research
Christopher Gannatti began at WisdomTree as a Research Analyst in December 2010, working directly with Jeremy Schwartz, CFA®, Director of Research. In January of 2014, he was promoted to Associate Director of Research where he was responsible to lead different groups of analysts and strategists within the broader Research team at WisdomTree. In February of 2018, Christopher was promoted to Head of Research, Europe, where he was based out of WisdomTree’s London office and was responsible for the full WisdomTree research effort within the European market, as well as supporting the UCITs platform globally. In November 2021, Christopher was promoted to Global Head of Research, now responsible for numerous communications on investment strategy globally, particularly in the thematic equity space. Christopher came to WisdomTree from Lord Abbett, where he worked for four and a half years as a Regional Consultant. He received his MBA in Quantitative Finance, Accounting, and Economics from NYU’s Stern School of Business in 2010, and he received his bachelor’s degree from Colgate University in Economics in 2006. Christopher is a holder of the Chartered Financial Analyst Designation.

