GDE
Efficient Gold Plus Equity Strategy Fund

Published December 9, 2025

Global Head of Research
Throughout history, gold has shown a consistent ability to preserve value when traditional risk assets face pressure. Its performance during equity market downturns and economic slowdowns underscores its function as a stabilizer within diversified portfolios. The following analysis explores how gold and gold–equity combinations have behaved across equity and business cycles, revealing patterns of resilience that complement both growth-oriented and defensive allocations. By understanding these historical dynamics, investors can better appreciate how gold exposure, implemented thoughtfully, can enhance portfolio balance across a wide range of market conditions.
Figure 1 highlights gold's resilience during equity market stress. Across the 20 worst quarters for the S&P 500 Index since 1967, gold delivered positive returns in 15 of them. While U.S. equities often experienced double-digit losses during these downturns, such as in 1974, 2008 and 2020, gold tended to either appreciate or limit declines, underscoring its historical role as a defensive asset. The pattern reflects gold's function as a store of value and potential portfolio stabilizer when risk assets are under pressure.
Figure 1: Gold Has Exhibited Resilience in Historical Equity Downturns
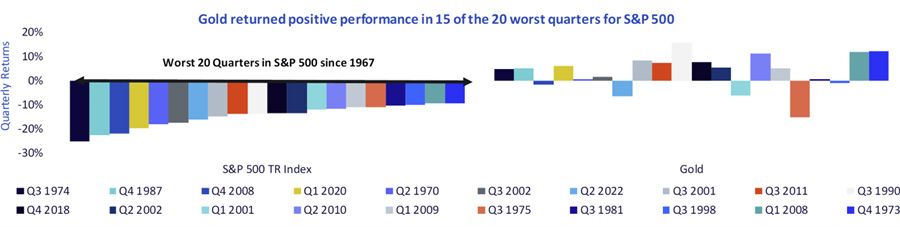
Sources: WisdomTree, Bloomberg. Data in U.S. dollar terms. From December 31, 1967, to June 30, 2025, using quarterly data. Gold is represented by the LBMA Gold Price PM Index, and the S&P 500 Index is shown in total return terms. Past performance is not indicative of future results. You cannot invest directly in an index.
In figure 2, the upper panel illustrates how U.S. equities, gold futures and a hypothetical blended 90/90 Gold Futures-S&P 500 Index portfolio1 have performed across different equity market regimes from 1999 to 2025. These regimes are defined by monthly U.S. equity returns:2 strongly negative (<–5%), negative (–5% to 0%), positive (0% to 5%) and strongly positive (>5%). The bars represent the average monthly returns of each strategy under these conditions. The data highlights that while equities experience large losses during downturns, gold and especially the blended portfolio tend to deliver more stable or positive performance, demonstrating gold's diversifying role during periods of equity stress.
The lower panel applies the same three asset groupings but organizes performance according to the OECD3 Composite Leading Indicator (CLI), which measures broad cyclical shifts in economic momentum. The CLI identifies four distinct business-cycle regimes, ranging from strongly negative to strongly positive signals, based on forward-looking indicators such as manufacturing, order books and consumer sentiment. This framework is useful because it captures turning points in global growth before they appear in traditional economic data. As shown, gold and the 90/90 hypothetical allocation have tended to perform more consistently across business-cycle phases, while equities show greater sensitivity to downturn signals.
Figure 2: Gold's Role through Equity and Business Cycles
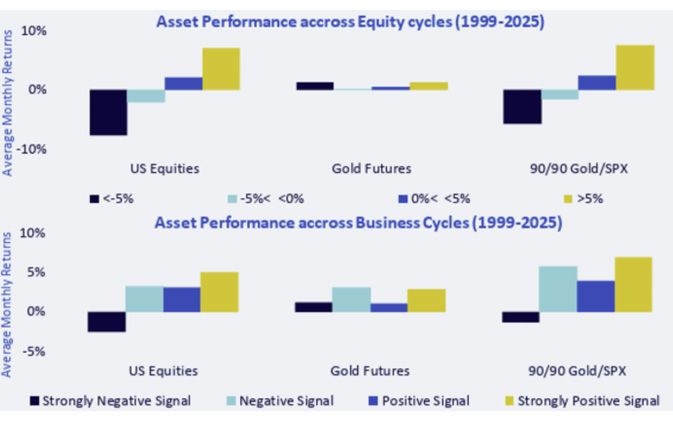
Sources: WisdomTree, Bloomberg, S&P. From November 1999 to June 30, 2025. Calculations are based on monthly returns data in U.S. dollar terms. Equities are represented by the S&P 500 Index. Gold futures are represented by the S&P GSCI Gold Index Excess Return Index. Upper chart buckets performance using S&P 500 Index performance thresholds (as indicated in the legend). Lower chart buckets performance in different parts of the business cycle using OECD Composite Lead Indicator signals (as indicated in the legend). The 90/90 Gold/SPX scenario represents a hypothetical allocation that incorporates leverage, to the tune of 180% notional exposure, combining gold futures and the S&P 500 Index. The return stream represents a leveraged sum of 90% of the returns of the S&P 500 Index and 90% of the return of gold futures. Past performance is not indicative of future results. You cannot invest directly in an index.
A Capital Efficient Exposure to Gold and U.S. Equities
The WisdomTree Efficient Gold Plus Equity Strategy Fund (GDE) is designed to provide investors with an option to cover two different asset allocation concepts:
1. Sometimes, investors are considering a gold allocation, but they have concerns that over long periods of time, gold is not a business, it does not have earnings or dividends, and it might be trickier to value. They may not want to remove exposure from equities and place it in gold. With GDE, it doesn't have to be "gold or equities," but rather it can be "gold and equities."
2 . We saw in figures 1 and 2 that in rougher periods for equities, gold's price his historically held up better. While we can never guarantee that history will repeat itself, a strategy that includes exposure to U.S. equities and gold futures is designed to take advantage of these historically lower correlations.
Figure 3 helps to contextualize the structure of GDE, indicating that for a hypothetical $100 invested, a certain notional exposure is achieved.
Figure 3: Looking under the Hood of GDE
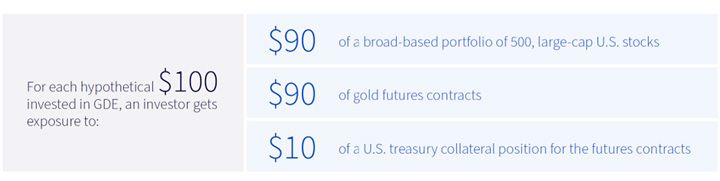
Source: WisdomTree. The accounting leverage is 1.8x, which refers to the fact that the total asset exposure of the strategy is enhanced to 1.8x of the Fund's net assets through the use of notional gold futures contracts. Enhancing or magnifying gains and losses causes the Fund to be more volatile than if it had not been leveraged and entails a heightened risk of loss.
Sources: WisdomTree, FactSet; specifically, data from the Fund Comparison Tool in the PATH suite of tools, accessed 10/15/25, with returns as of 9/30/25. NAV denotes total return performance at net asset value. MP denotes market price performance. Past performance is not indicative of future results. Investment return and principal value of an investment will fluctuate so that an investor's shares, when redeemed, may be worth more or less than their original cost. Current performance may be lower or higher than the performance data quoted. For the most recent month-end and standardized performances, click the relevant ticker: GDE, SPY, AGG.
Considering Portfolio Allocations
Figure 5a compares a traditional 60/40 portfolio, with 60% U.S. equities and 40% U.S. fixed income,4 to an alternative allocation that introduces gold exposure through GDE. In this revised 50/40/10 structure, 10% of the portfolio is allocated to GDE, while equities are reduced to 50% and fixed income remains at 40%. This adjustment modestly rebalances risk while introducing an allocation designed to enhance diversification and potentially improve portfolio resilience during periods of equity or bond stress.
The second chart translates these allocations into notional asset class exposures, recognizing that GDE provides simultaneous exposure to both equities and gold futures. Specifically, a 10% allocation to GDE contributes roughly 9% equity exposure and 9% gold futures exposure, resulting in total portfolio exposures of approximately 59% equities, 40% fixed income and 9% gold futures. This structure allows investors to incorporate meaningful gold diversification without significantly diluting equity exposure, thereby maintaining growth potential while adding an asset historically uncorrelated with stocks and bonds.
Figure 5a:ETF Allocations
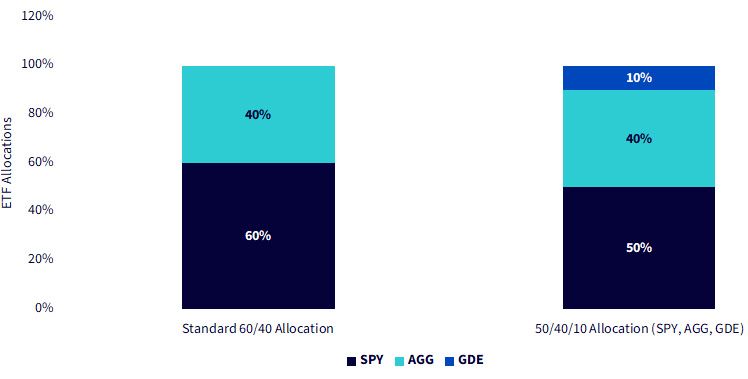
Source for hypothetical allocations: WisdomTree
Figure 5b: Notional Asset Class Exposures
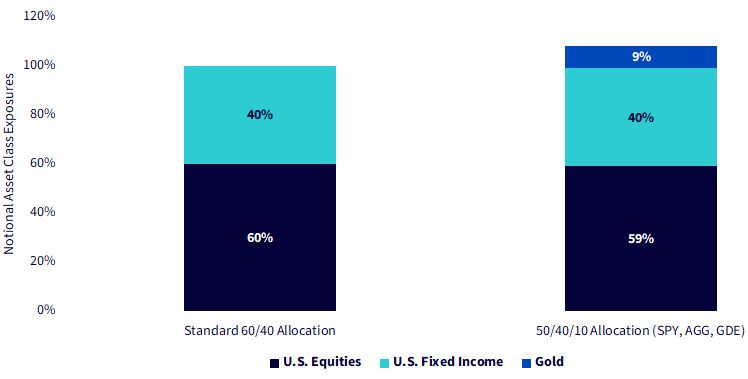
Source for notional asset class exposures: WisdomTree. Gold, in this context, is specifically gold futures.
Conclusion: Looking at the Allocation Returns
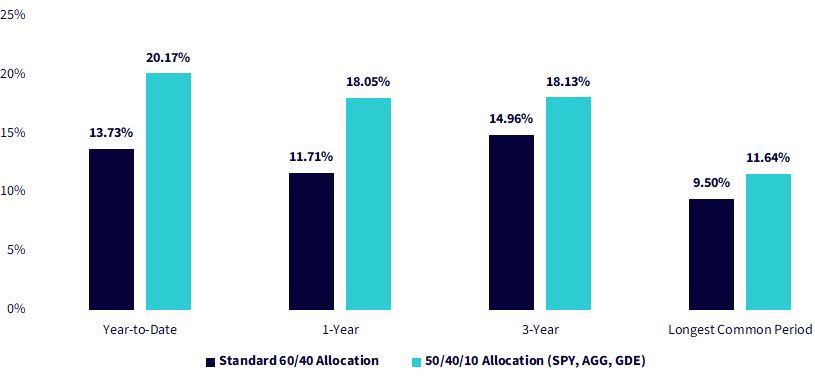
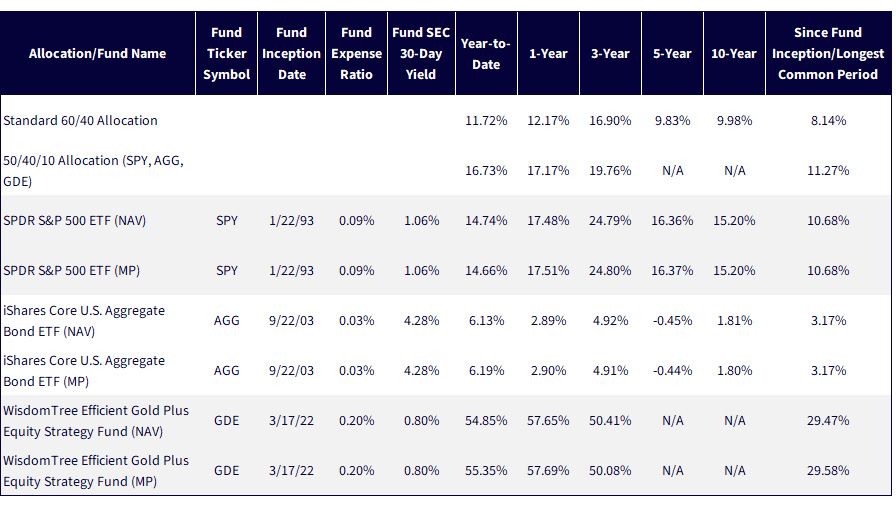
Sources: WisdomTree, FactSet; specifically, data from the Fund Comparison Tool in the PATH suite of tools, accessed 11/28/25, with returns as of 11/26/25. NAV denotes total return performance at net asset value. MP denotes market price performance. Past performance is not indicative of future results. Investment return and principal value of an investment will fluctuate so that an investor's shares, when redeemed, may be worth more or less than their original cost. Current performance may be lower or higher than the performance data quoted. For the most recent month-end and standardized performances, click the relevant ticker: GDE, SPY, AGG.
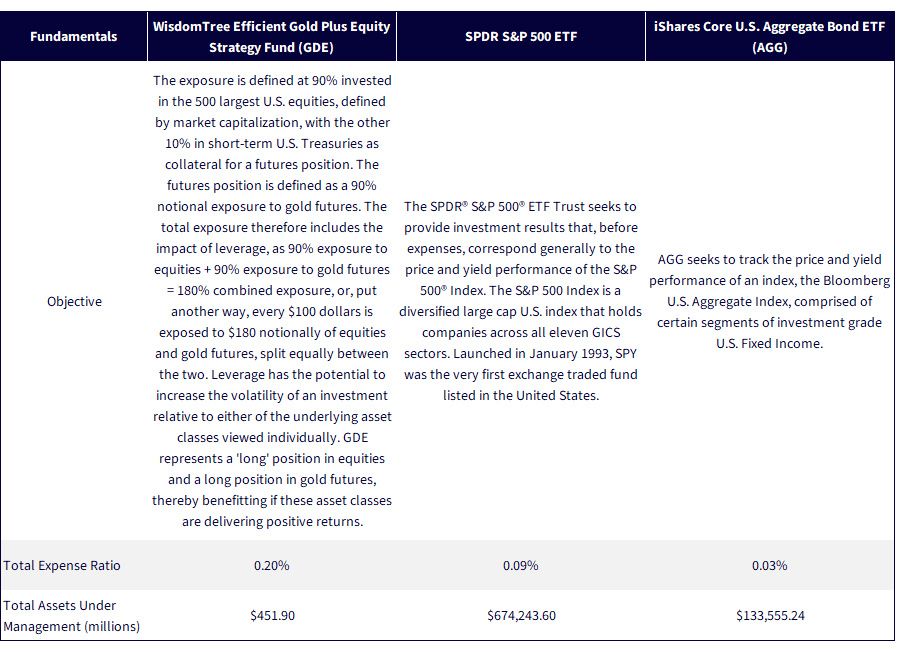
Sources: Respective Fund pages for WisdomTree, SPDR and iShares. Assets under management data is as of 10/14/25. Subject to change.
1 The 90/90 Gold/SPX scenario represents a hypothetical allocation that incorporates leverage, to the tune of 180% notional exposure, combining gold futures and the S&P 500 Index. The return stream represents a leveraged sum of 90% of the returns of the S&P 500 Index and 90% of the return of gold futures.
2 The universe for U.S. equity returns is the S&P 500 Index.
3 OECD stands for The Organisation for Economic Co-operation and Development.
4 The original 60/40 allocation uses the SPDR S&P 500 ETF (SPY) for the equity component and the iShares Core U.S. Aggregate Bond ETF (AGG) for the fixed income component. These two strategies are among the largest, based on assets under management, tracking these respective benchmarks across the U.S. equity landscape.
All funds are managed differently and do not react the same to economic or market events. The investment objectives, strategies, policies or restrictions of other funds may differ, and more information can be found in their respective prospectuses. Therefore, we generally do not believe it is possible to make direct fund-to-fund comparisons in an effort to highlight the benefits of a fund versus another similarly managed fund.
GDE: There are risks associated with investing, including the possible loss of principal. The Fund is actively managed and invests in U.S.-listed gold futures and U.S. equity securities. The Fund’s use of U.S.-listed gold futures contracts will give rise to leverage, magnifying gains and losses and causing the Fund to be more volatile than if it had not been leveraged. Moreover, the price movements in gold and gold futures contracts may fluctuate quickly and dramatically and have a historically low correlation with the returns of the stock and bond markets. U.S. equity securities, such as common stocks, are subject to market, economic and business risks that may cause their prices to fluctuate. The Fund’s investment strategy will also require it to redeem shares for cash or to otherwise include cash as part of its redemption proceeds, which may cause the Fund to recognize capital gains. Please read the Fund’s prospectus for specific details regarding the Fund’s risk profile.
SPY: The Fund is subject to risk, including the possible loss of principal. The Fund seeks to track the performance of the S&P 500 Index and does not attempt to outperform it. Equity securities may fluctuate in value in response to the activities of individual companies and general market and economic conditions. The Fund is subject to general market risk, equity investing risk and passive investment risk. ETFs may trade at prices above or below their net asset value (NAV) and are subject to brokerage commissions and trading costs.
Before investing, consider the Fund’s investment objectives, risks, charges and expenses. For more information, obtain a prospectus or summary prospectus at www.ssga.com or call 1-866-787-2257. Read it carefully.
AGG: Fixed income risks include interest rate and credit risk. Typically, when interest rates rise, there is a corresponding decline in bond values. Credit risk refers to the possibility that the bond issuer will not be able to make principal and interest payments.
Diversification may not protect against market risk or the loss of principal. Shares of ETFs are bought and sold at market price (not NAV) and are not individually redeemed from the Fund. Any applicable brokerage commissions will reduce returns.
Efficient Gold Plus Equity Strategy Fund

Global Head of Research
Christopher Gannatti began at WisdomTree as a Research Analyst in December 2010, working directly with Jeremy Schwartz, CFA®, Director of Research. In January of 2014, he was promoted to Associate Director of Research where he was responsible to lead different groups of analysts and strategists within the broader Research team at WisdomTree. In February of 2018, Christopher was promoted to Head of Research, Europe, where he was based out of WisdomTree’s London office and was responsible for the full WisdomTree research effort within the European market, as well as supporting the UCITs platform globally. In November 2021, Christopher was promoted to Global Head of Research, now responsible for numerous communications on investment strategy globally, particularly in the thematic equity space. Christopher came to WisdomTree from Lord Abbett, where he worked for four and a half years as a Regional Consultant. He received his MBA in Quantitative Finance, Accounting, and Economics from NYU’s Stern School of Business in 2010, and he received his bachelor’s degree from Colgate University in Economics in 2006. Christopher is a holder of the Chartered Financial Analyst Designation.


