QGRW
U.S. Quality Growth Fund

Published May 21, 2025

Global Head of Research
There was a moment earlier this year when the market seemed ready to move on from artificial intelligence. The "AI trade" felt saturated. Valuations had stretched. And for many, the story had started to feel stale. Traders wanted a new narrative, something with more torque. But then, the earnings came in for the period ended March 31, 2025.
From Microsoft and Alphabet to Amazon, Apple and Meta, some of the largest companies in the world1 reminded us of a simple truth: AI is not a trade. It's a transition. It's not a sprint—it's a structural shift reshaping technology, capital allocation and ultimately the nature of competition.
Take capital spending. The idea that we were past "peak capex" has been proven wrong, at least based on the current statements from the companies. Microsoft reiterated its plan to grow FY25 capital expenditures by 58%,2 and it did so not with vague ambition but with surgical intent—shifting spend toward short-duration, revenue-linked server infrastructure. Alphabet maintained its $75 billion capex guidance for 2025, more than doubling its historic run rate.3 Amazon, meanwhile, reported capex that beat estimates by 22% as it built up logistics and infrastructure in anticipation of potential tariff fallout.4 Even Meta, often under-discussed in this context, raised its own capex guidance to a range of $64 billion to $72 billion, with the majority going to AI infrastructure to power its core advertising and recommendation engines.5
While headlines obsess over the next new large language model, robotic agents and AI's potential to write your emails or your code, the real story—the one that explains who wins and who gets left behind—is buried in capital expenditures.
Look at this chart, figure 1. It's not just a bar graph. It's the pulse of a new industrial revolution.
From 2013 to 2020, cloud infrastructure capex rose methodically—from $32 billion to $119 billion. That's significant, but manageable. Post-2020? The curve steepens. By 2024, we hit $285 billion. And in 2025 alone, the top 11 cloud providers are forecasted to deploy a staggering $392 billion—more than the entire previous two years combined.
That's the story: AI isn't just an algorithmic leap—it's a hardware war. The shift from software-scale AI to infrastructure-scale AI means the bottleneck isn't talent, or model design, or even regulation. It's data centers, power, fiber, cooling and chips.
And this surge in spending isn't discretionary. It's existential. If you're a cloud provider, and you don't scale compute, storage and throughput to match AI's appetite, you're out of the game. Amazon, Microsoft, Alphabet and their challengers know this. That's why the capex needle is vertical.
1. Infrastructure is the new alpha. The value chain of AI is collapsing downward. If you're not tracking semiconductor supply, power grid reliability and hyperscaler buildouts, you're missing the picture.
2. Capex is not cyclical here—it's foundational. This isn't like prior waves of tech spending that faded when consumer demand softened. AI workloads—training and inference—are compute-thirsty and persistent.
3. Index exposure may not be enough. Many traditional indexes under-weight the arms suppliers of this war: data center real estate investment trusts (REITs), optical networking firms, custom silicon fabricators and even advanced heating, ventilation and air conditioning (HVAC) companies.
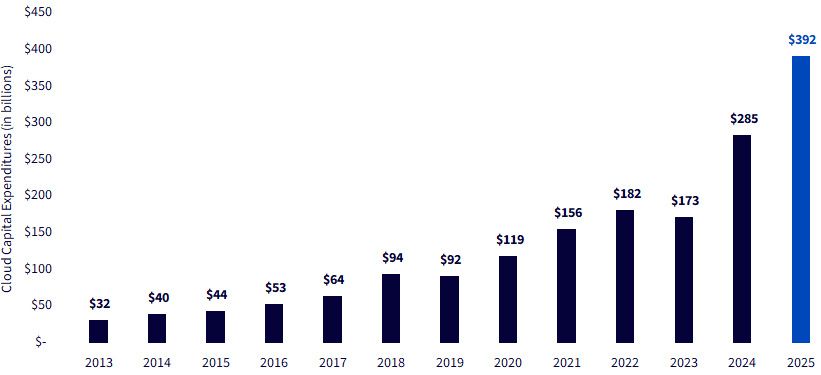
Source: Morgan Stanley Research, "Cloud Capex Tracker: '25 growth now at 38% Y/Y" [Equity research report], 2025. 2025 is shaded in a lighter color because it represents an estimated value, not a completed year, based on what the 11 companies have guided so far. This guidance can change, reducing the 2025 figure. Past performance is not indicative of future results.
But capital spend is only part of the story. These companies are no longer just investing in AI; they are now generating revenue with it. Microsoft's Azure AI contributed 16 percentage points to Azure's 35% year-over-year growth.6 AWS, Amazon's cloud unit, posted a 39% EBIT margin, crediting GenAI for operational leverage.7 Alphabet's cloud division hit an all-time high 18% operating margin,8 while Meta is embedding generative AI throughout its ad stack to drive personalization, discovery and engagement—all of which reinforce the core revenue engine. Only Apple was conspicuously quiet, offering no new updates on Siri or GenAI monetization, even as its peers continue to sprint forward.
Yet just as digital intelligence accelerates, real-world friction is mounting. Tariffs, supply chains and geopolitics are now inseparable from technology strategy. Amazon is modeling a 145% China tariff starting in Q3 2025, already absorbing more than $1 billion in one-time logistics and inventory repositioning costs.9 Apple expects $900 million in tariff-related costs in the June quarter alone, despite shifting over half of its U.S.-bound iPhone assembly to India.10 Alphabet and Meta, while less exposed to hardware flows, are dealing with second-order effects: advertisers trimming budgets, cloud customers pulling back and an underlying uncertainty that can't be hedged with servers.
In this environment, the quality of cash flow becomes a kind of North Star. Microsoft delivered a 7% EPS beat with operating margin expansion, even as it scaled investment.11 Alphabet posted $2.81 in GAAP EPS, well above estimates, partly aided by an $8 billion equity investment gain but supported by genuine operating leverage.12 Amazon's cash flow turned negative this quarter, a reflection of its pre-tariff inventory bulking.
Capital return activity reinforces this picture. Apple announced $100 billion in share buybacks and a 4% dividend hike.13 Alphabet introduced a new $70 billion buyback authorization and raised its quarterly dividend by 5%.14 Microsoft, as steady as ever, continued returning capital without fanfare. Amazon, true to its growth-first DNA, continues to reinvest.
Still, the road ahead is not without risk. Apple must scale its India supply chain before tariffs close in. Alphabet is confronting the possibility that its own Gemini-generated answers may cannibalize search ad clicks, as well as a series of court rulings where possible remedies include suggestions to break up the company. Microsoft sees strong demand but warned of a supply-demand imbalance in AI infrastructure heading into the second half of the year. Amazon needs tariff clarity to offer any meaningful guidance. And Meta, with its ad business still vulnerable to economic cyclicality, is betting that infrastructure and models can offer more resilience than forecasts.
This is where we are: in the middle of a generational technology shift that is increasingly grounded in cash flows, capex strategy, margin discipline and geopolitical navigation. The market may still be trying to treat AI like a theme to be rotated into or out of. But the companies building this future aren't playing that game.
They're laying track for a new digital economy.
And if Q1 2025 reminded us of anything, it's that we are still in the early chapters of that story.
Conclusion: A Diversified Approach Focused on the "Mag 7"15
We have been writing about some of the largest companies in the U.S. market, and they tend to be included within the broader moniker "Magnificent 7" that was coined to account for how basically seven companies were responsible for such a large portion of the U.S. equity market's gains over 2023 and 2024.
The WisdomTree U.S. Quality Growth Fund (QGRW) is not explicitly designed to gain exposure to these companies, but in tracking the WisdomTree U.S. Quality Growth Index before fees and expenses, the characteristics like return on equity, earnings growth and return on assets that are favored by this approach are also prevalent in these seven large companies. Market-capitalization weighting pushes large allocations in their direction once they qualify.
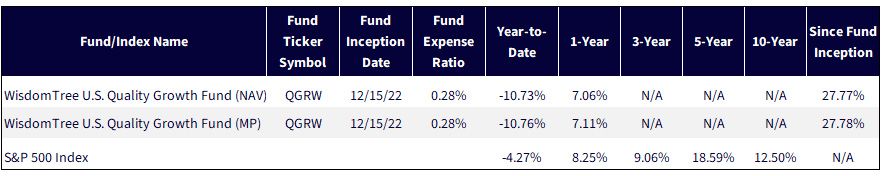
Sources: WisdomTree, FactSet, specifically data from the Fund Comparison Tool in the PATH suite of tools, accessed 5/3/25 with returns as of 3/31/25. NAV denotes total return performance at net asset value. MP denotes market price performance. The performance data quoted represents past performance. Past performance is not indicative of future results. Investment return and principal value of an investment will fluctuate so that an investor's shares, when redeemed, may be worth more or less than their original cost. Current performance may be lower or higher than the performance data quoted. For the most recent month-end and standardized performances, click here.
The ultimate exposure of QGRW elevates the Magnificent 7 companies into the portfolio's defining thesis, which is clear in figure 3. Apple, Nvidia and Microsoft alone comprise more than 30%, reflecting that the AI-powered, platform-dominated economy is a central exposure.
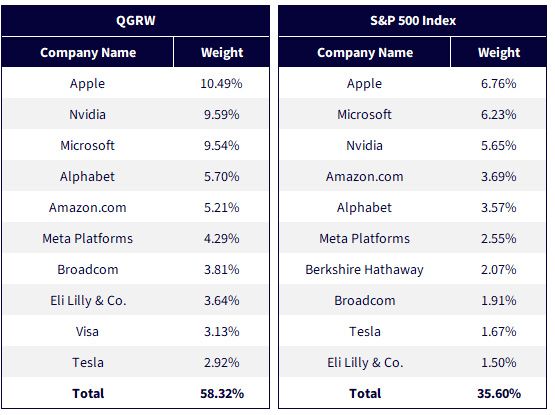
Sources: WisdomTree, FactSet, specifically the Fund Compare tool from WisdomTree's PATH set of tools, with holdings data as of 4/30/25. Subject to change.
When the market reinterpreted the Trump administration's evolving communications—particularly around tariffs, tax and tech policy—it was portfolios like QGRW, concentrated in the companies the market believes may outrun policy shifts. Over the April 21 to May 16 window, QGRW pulled decisively ahead of the S&P 500, as investors recalibrated toward platforms with pricing power, cash flows and moats that may not be subject to election-year whiplash. Still, we recognize that a big part of this move was catalyzed by the seemingly negotiated pause in tariff escalation between the U.S. and China.
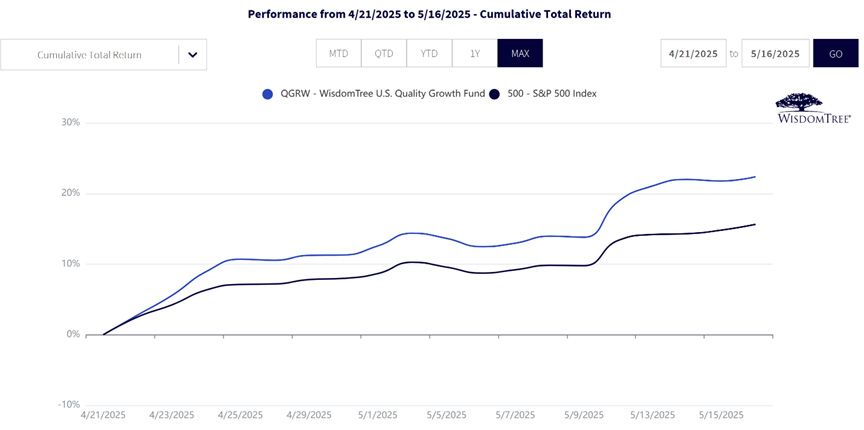
Sources: WisdomTree, FactSet, specifically data from the Fund Comparison Tool in the PATH suite of tools, accessed 5/3/25 with returns as of 4/21/25 to 5/16/25. NAV denotes total return performance at net asset value. MP denotes market price performance. Past performance is not indicative of future results. Investment return and principal value of an investment will fluctuate so that an investor's shares, when redeemed, may be worth more or less than their original cost. Current performance may be lower or higher than the performance data quoted. For the most recent month-end and standardized performances, click here.
Of course, that same high-conviction exposure cuts both ways. In the first week of April, as we see in figure 5, when markets briefly recoiled on fears of escalating tariffs and broader risk-off sentiment, QGRW fell harder than the S&P 500—underscoring what may happen when the market questions the multiple expansion supporting the Magnificent 7.
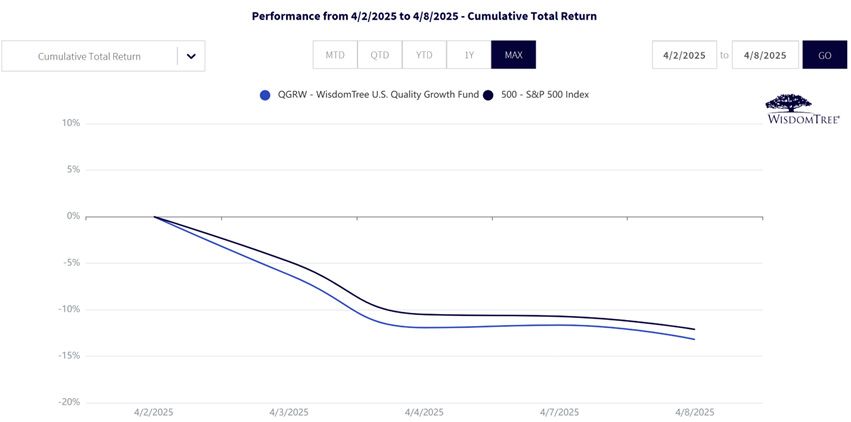
Sources: WisdomTree, FactSet, specifically data from the Fund Comparison Tool in the PATH suite of tools, accessed 5/3/25 with returns as of 4/2/25 to 4/8/25. NAV denotes total return performance at net asset value. MP denotes market price performance. Past performance is not indicative of future results. Investment return and principal value of an investment will fluctuate so that an investor's shares, when redeemed, may be worth more or less than their original cost. Current performance may be lower or higher than the performance data quoted. For the most recent month-end and standardized performances, click here.
Bottom line: While short-term periods can be quite volatile, if investors are looking at some of the world's biggest companies that we have discussed in this piece, QGRW represents an interesting way to consider a diversified exposure that does push an emphasis in their direction. Our opinion is that the longer-term case for bearishness on these companies could be overstated—and we'll continue to watch how things play out.
1 "Largest" is determined on the basis of market capitalization measured as of May 2, 2025, with source Bloomberg.
2 Source: Morgan Stanley Research, "Cloud Capex Tracker: '25 Growth Now At 38% Y/Y" [Equity research report], 5/1/25.
3 Source: Goldman Sachs Global Investment Research, "Alphabet Inc. (GOOGL): Q1'25 review—Results demonstrate resilient search & rising AI narratives" [Equity research report], 4/25/25.
4 Source: Morgan Stanley Research, "Amazon.com Inc: Solid results and strategy—Now we need tariff visibility" [Equity research report], 5/2/25.
5 Source: Morgan Stanley Research, "Cloud Capex Tracker: '25 growth now at 38% Y/Y" [Equity research report], 2025.
6 Source: Morgan Stanley Research, "Microsoft: 3Q25 results – Are we ready to believe?" [Equity research report], 5/1/25.
7 Source: Morgan Stanley Research, "Amazon.com Inc: Solid results and strategy—Now we need tariff visibility" [Equity research report], 2025.
8 Source: Goldman Sachs Global Investment Research, "Alphabet Inc. (GOOGL): Q1'25 review—Results demonstrate resilient search & rising AI narratives" [Equity research report], 2025.
9 Source: Morgan Stanley Research, "Amazon.com Inc: Solid results and strategy—Now we need tariff visibility" [Equity research report], 2025.
10 Source: Morgan Stanley Research, "Apple, Inc.: Some clarity, but plenty of uncertainties" [Equity research report], 2025.
11 Source: Morgan Stanley Research, "Microsoft: 3Q25 results – Are we ready to believe?" [Equity research report], 2025.
12 Source: Goldman Sachs Global Investment Research, "Alphabet Inc. (GOOGL): Q1'25 review—Results demonstrate resilient search & rising AI narratives" [Equity research report], 2025.
13 Source: Apple Inc., "Apple reports second quarter results" [Press release], https://investor.apple.com, 5/2/25.
14 Source: Goldman Sachs Global Investment Research, "Alphabet Inc. (GOOGL): Q1'25 review—Results demonstrate resilient search & rising AI narratives" [Equity research report], 2025.
15 Short for Magnificent 7, which refers to Apple, Amazon.com, Alphabet, Meta Platforms, Microsoft, Nvidia and Tesla.
For current holdings of QGRW, please click here. Holdings are subject to risk and change.
There are risks associated with investing, including the possible loss of principal. Growth stocks, as a group, may be out of favor with the market and underperform value stocks or the overall equity market. Growth stocks are generally more sensitive to market movements than other types of stocks. The Fund is non-diversified; as a result, changes in the market value of a single security could cause greater fluctuations in the value of Fund shares than would occur in a diversified fund. The Fund invests in the securities included in, or representative of, its Index regardless of their investment merit. The Fund does not attempt to outperform its Index or take defensive positions in declining markets, and the Index may not perform as intended. Please read the Fund’s prospectus for specific details regarding the Fund’s risk profile.
U.S. Quality Growth Fund

Global Head of Research
Christopher Gannatti began at WisdomTree as a Research Analyst in December 2010, working directly with Jeremy Schwartz, CFA®, Director of Research. In January of 2014, he was promoted to Associate Director of Research where he was responsible to lead different groups of analysts and strategists within the broader Research team at WisdomTree. In February of 2018, Christopher was promoted to Head of Research, Europe, where he was based out of WisdomTree’s London office and was responsible for the full WisdomTree research effort within the European market, as well as supporting the UCITs platform globally. In November 2021, Christopher was promoted to Global Head of Research, now responsible for numerous communications on investment strategy globally, particularly in the thematic equity space. Christopher came to WisdomTree from Lord Abbett, where he worked for four and a half years as a Regional Consultant. He received his MBA in Quantitative Finance, Accounting, and Economics from NYU’s Stern School of Business in 2010, and he received his bachelor’s degree from Colgate University in Economics in 2006. Christopher is a holder of the Chartered Financial Analyst Designation.
