
Two Complementary Strategies Create a Better Core
Published January 27, 2025

Global Head of Research
Key Takeaways
- Combining the WisdomTree U.S. Quality Growth Fund (QGRW) and the WisdomTree U.S. Value Fund (WTV) creates a core portfolio that leverages both growth and value strategies to adapt to shifting market dynamics.
- By pairing quality growth stocks with others with lower valuations and higher total shareholder yields, the blend mitigates valuation risks—outperforming the S&P 500 Index with a consistent, risk-conscious approach.
- With sector alignment and exposure to recognizable companies, including the “Magnificent 7,” this hybrid strategy provides investors with diversification, disciplined valuation and innovation-driven growth potential.
As 2025 begins, equity markets pose an intriguing challenge for investors. With interest rates, technological innovation and global supply chains in flux, the perennial debate between growth and value investing gains fresh urgency.
Growth strategies, focusing on rapidly expanding companies, often excel in low-interest, liquidity-rich environments. Value strategies, emphasizing undervalued companies with strong fundamentals, shine during recoveries or corrections. Predicting which will lead remains difficult.
But why choose? A hybrid approach blending value and growth could offer a versatile strategy for today’s complex markets. By combining disciplined valuation with innovation-driven growth, investors can seize opportunities across diverse scenarios—whether inflation shifts, geopolitical tensions evolve, or economic trends fluctuate.
WisdomTree’s Value and Quality Growth Strategies
To create the 50/50 core blend, we look to two specific WisdomTree strategies:
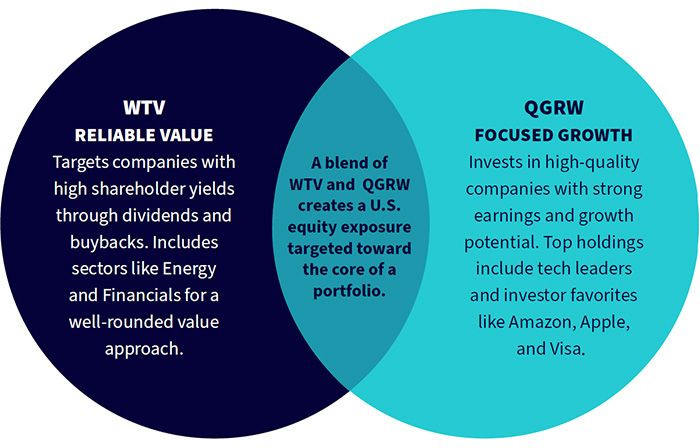
- WisdomTree U.S. Quality Growth Fund (QGRW): The strategy seeks to track the total return performance, before fees and expenses, of the WisdomTree U.S. Quality Growth Index. This market capitalization-weighted strategy focuses on 100 companies that deliver particularly strong earnings growth and quality fundamental metrics. There is an overlap between this strategy and the Nasdaq 100, but we believe in our more disciplined focus on selecting consistent quality growers instead of the venue where the stock has a primary listing for trading.
- WisdomTree U.S. Value Fund (WTV): The strategy seeks income and capital appreciation by investing primarily in U.S. equity securities that provide a high total shareholder yield with favorable relative quality characteristics. The Fund’s objective changed effective December 18, 2017. Prior to December 18, 2017, Fund performance reflects the investment objective of the Fund when it tracked the performance, before fees and expenses, of the WisdomTree U.S. LargeCap Value Index.
The combination of these two strategies leads to a strong balance of sector exposures, attractive fundamental metrics and, while limited, a nice performance history.
Figure 1: Envisioning the 50/50 Blend
Source: WisdomTree
Figure 2: Standardized Performance as of 12/31/24
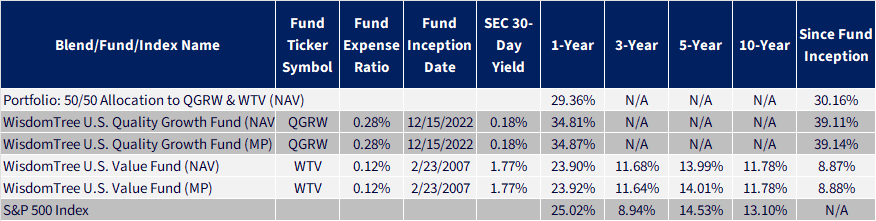
Source: WisdomTree, specifically data from the Fund Comparison Tool in the PATH suite of tools, accessed 1/15/25, with returns as of 12/31/24. SEC 30-Day Yield as of 12/31/24. NAV denotes total return performance at net asset value. MP denotes market price performance. In the case of WTV, the Fund’s objective changed effective 12/18/17. Prior to 12/18/17, Fund performance reflects the investment objective of the Fund when it tracked the performance, before fees and expenses, of the WisdomTree U.S. LargeCap Value Index. Past performance is not indicative of future results. Investment return and principal value of an investment will fluctuate so that an investor’s shares, when redeemed, may be worth more or less than their original cost. Current performance may be lower or higher than the performance data quoted. For the most recent month-end and standardized performances, click the relevant ticker: QGRW, WTV.
2024: A Test
The 2024 equity market environment was very similar to 2023—putting more focus on larger companies paid off.
A drawback of simply following the momentum of large growth is that, ultimately, valuation matters. Valuation may not drive the market downward in the near term, but long-term investors know risk builds as valuation multiples rise and set a higher hurdle to clear with each earnings report.
Are the first couple of weeks of 2025 a hint toward a change in market leadership? While it’s too soon to say, as you contrast figures 3a and 3b, you might see how a blended approach is navigating this potentially different environment.
Figure 3a: Cumulative Returns in 2024
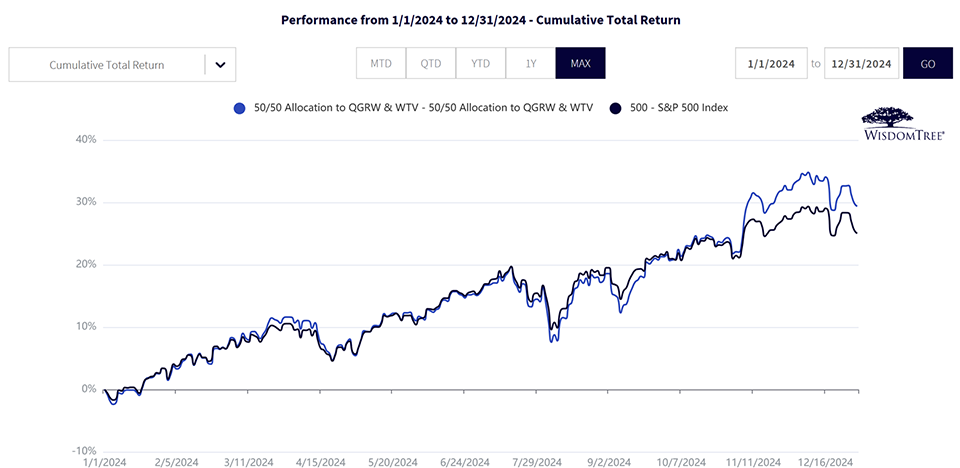
Source: WisdomTree, specifically data from the Fund Comparison Tool in the PATH suite of tools, accessed 1/15/25. NAV denotes total return performance at net asset value. MP denotes market price performance. Past performance is not indicative of future results. Investment return and principal value of an investment will fluctuate so that an investor’s shares, when redeemed, may be worth more or less than their original cost. Current performance may be lower or higher than the performance data quoted. For the most recent month-end and standardized performances and to download the respective Fund prospectuses, click the relevant ticker: QGRW, WTV.
Figure 3b: A New Test as We Begin 2025
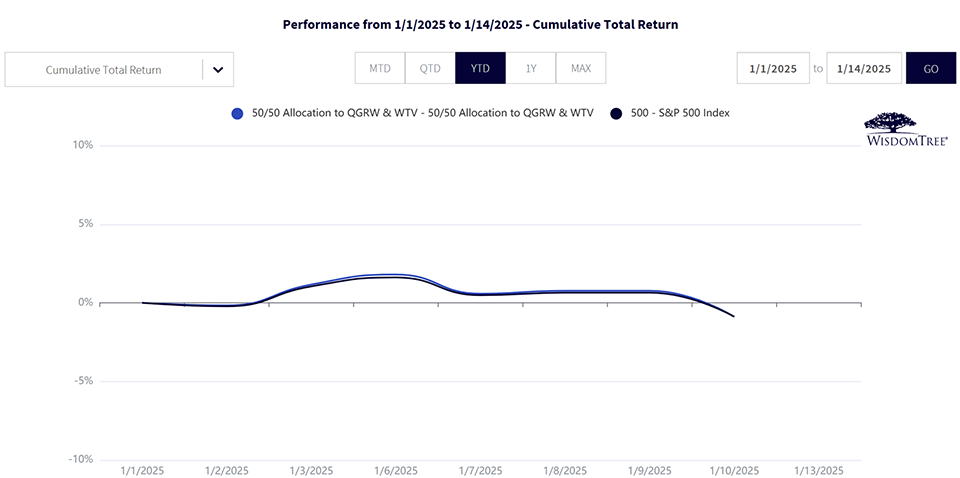
Source: WisdomTree, specifically data from the Fund Comparison Tool in the PATH suite of tools, accessed 1/15/25. NAV denotes total return performance at net asset value. MP denotes market price performance. Past performance is not indicative of future results. Investment return and principal value of an investment will fluctuate so that an investor’s shares, when redeemed, may be worth more or less than their original cost. Current performance may be lower or higher than the performance data quoted. For the most recent month-end and standardized performances and to download the respective Fund prospectuses, click the relevant ticker: QGRW, WTV.
Rolling Returns to Test Consistency
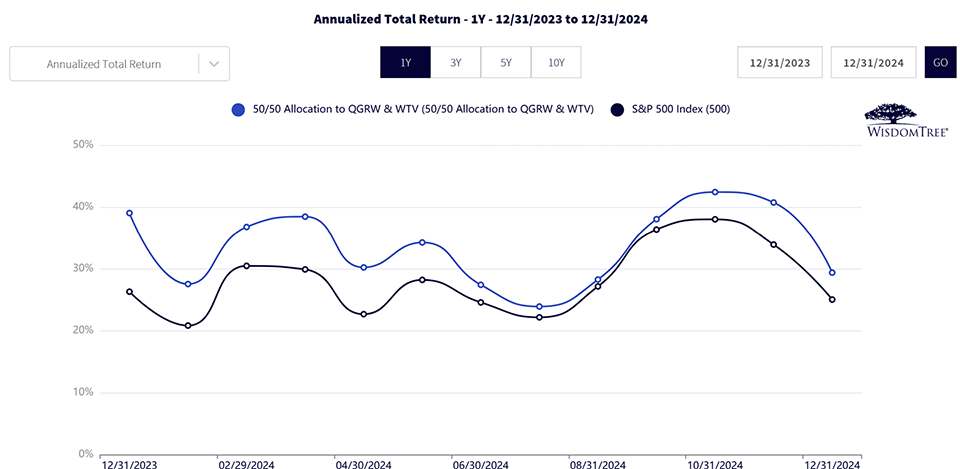
In figure 4, we show that for rolling one-year periods, the 50/50 allocation to QGRW and WTV has outperformed the S&P 500 Index consistently since QGRW began trading in December 2022—albeit a limited history, but what we do have so far looks consistent.
Figure 4: Rolling One-Year Returns for a Measure of Consistency
Source: WisdomTree, specifically data from the Fund Comparison Tool in the PATH suite of tools, accessed 1/15/25. NAV denotes total return performance at net asset value. MP denotes market price performance. Past performance is not indicative of future results. Investment return and principal value of an investment will fluctuate so that an investor’s shares, when redeemed, may be worth more or less than their original cost. Current performance may be lower or higher than the performance data quoted. For the most recent month-end and standardized performances and to download the respective Fund prospectuses, click the relevant ticker: QGRW, WTV.
Big Sector Deviations Can Make Investors Nervous
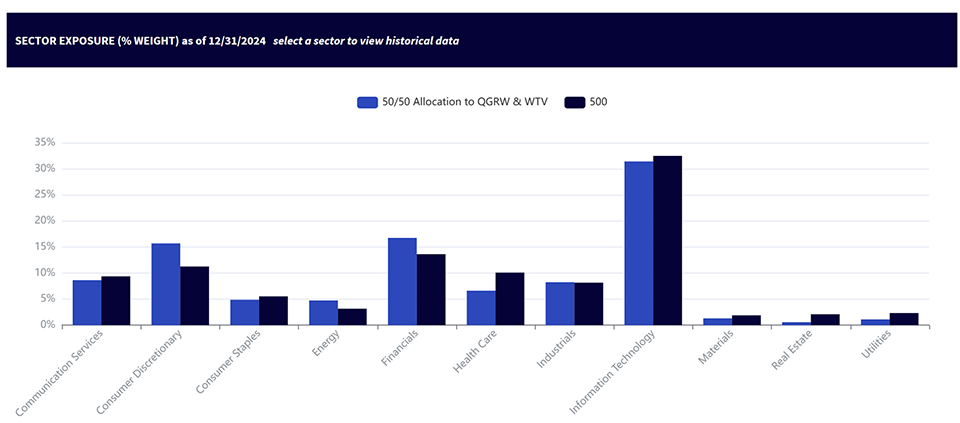
The 50/50 QGRW/WTV combination delivered outperformance without being too “different” from the market from a sector perspective.
Figure 5 compares the sector exposures in the 50/50 QGRW/WTV portfolio to the S&P 500 Index. There are differences, but the 50/50 blend is not making massive sector bets versus the benchmark either.
Figure 5: Sector Allocations vs. the S&P 500 Index
Source: WisdomTree, specifically data from the Fund Comparison Tool in the PATH suite of tools, accessed 1/15/25. Holdings subject to change.
Managing the Risk of Overvaluation
Benjamin Graham stated, “In the short run, the market is a voting machine, but in the long run, it is a weighing machine.”1
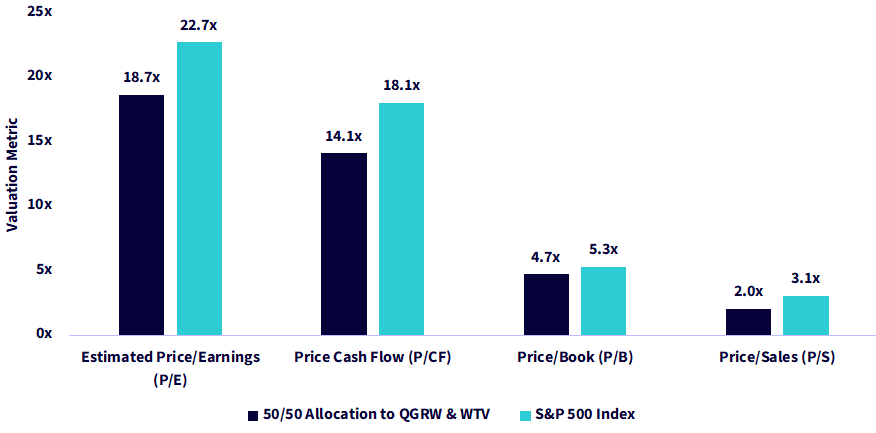
The 50/50 allocation to QGRW and WTV balances exposures to premier growth stocks with the WTV value component of the strategy to mitigate the risk of seeing valuation metrics run up too high versus the S&P 500 Index benchmark. The combination yields a portfolio with a lower overall valuation than the market due to the deep discounts in WTV holdings.
Figure 6: Assorted Valuation Metrics
Source: WisdomTree, specifically data from the Fund Comparison Tool in the PATH suite of tools, accessed 1/15/25. Holdings subject to change.
Shareholder Yield as a Measure of Quality
One path unprofitable companies use to stay afloat is the issuance of equity during growth modes. Small stocks, such as those in the Russell 2000 Index, exemplify this.
Profitable companies, on the other hand, have a choice in returning cash to shareholders—some choose dividends, and others choose buybacks. In the U.S. market, a lot of the largest, most profitable companies like share buybacks because executives tend to have option-based compensation.
Buybacks are also much easier to think of on a one-time basis, whereas dividends, culturally, create a future unending covenant with shareholders.2
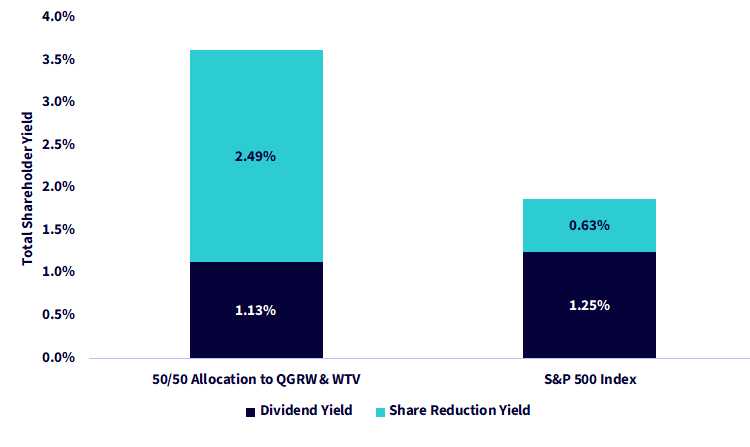
WTV has a direct focus on companies that are reducing shares outstanding through buybacks. The 50/50 allocation to QGRW and WTV has a very similar dividend yield to the S&P 500 Index, but the share reduction yield is more than three times higher.
Figure 7: A Focus on Shareholder Yield
Source: WisdomTree, specifically data from the Fund Comparison Tool in the PATH suite of tools, accessed 1/15/25. Holdings subject to change.
Top 10 Holdings: Connecting the Strategy Back to Companies
People connect with recognizable company names.
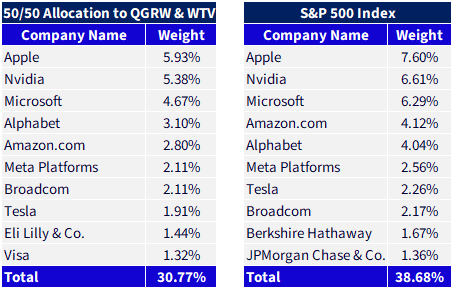
Figure 8 shows both the 50/50 allocation to QGRW and WTV and the S&P 500 Index have exposure to the Magnificent 73 stocks within the top 10 at similar weights, although the blend does tend to trim down the exposures to the largest positions, such as Apple and Nvidia.
We have seen investors looking to at least trim the concentrated risk they see in the largest companies as we start 2025.
Eight out of the top 10 holdings are actually the same. Eli Lilly & Co. and Visa are the different positions within the 50/50 blend, whereas Berkshire Hathaway and JPMorgan Chase & Co. are the different positions within the S&P 500 Index.
Figure 8: A Top 10 Holdings Similar to the S&P 500 Index
Source: WisdomTree, specifically data from the Fund Comparison Tool in the PATH suite of tools, accessed 1/15/25. Holdings subject to change.
Conclusion: Value and Growth as Opposed to Value OR Growth
As you look toward 2025 and wonder whether value or growth will have the potential to run, we’d simply note that the discussion can very easily shift to value and growth from value or growth. This combination creates a better core, and we believe it has attractive characteristics to continue adding value.
1Source: This concept is widely attributed to Benjamin Graham, but the precise wording does not appear in such books as The Intelligent Investor or Security Analysis. It is likely something he said in some of his lectures.
2While dividends are by no means “guaranteed,” we use the words “unending covenant” because the investing public creates an expectation that dividends must at least be maintained and, better yet, grown incrementally. Cutting a dividend tends to be seen very negatively by investors in U.S. equities, even if they understand this to be an ever-present risk.
3Magnificent 7 refers to Amazon.com, Apple, Alphabet, Microsoft, Meta Platforms, Nvidia and Tesla.
Important Risks Related to this Article
QGRW: There are risks associated with investing, including the possible loss of principal. Growth stocks, as a group, may be out of favor with the market and underperform value stocks or the overall equity market. Growth stocks are generally more sensitive to market movements than other types of stocks. The Fund is non-diversified; as a result, changes in the market value of a single security could cause greater fluctuations in the value of Fund shares than would occur in a diversified fund. The Fund invests in the securities included in, or representative of, its Index regardless of their investment merit. The Fund does not attempt to outperform its Index or take defensive positions in declining markets, and the Index may not perform as intended. Please read the Fund’s prospectus for specific details regarding the Fund’s risk profile.
WTV: There are risks associated with investing, including the possible loss of principal. Funds focusing their investments on certain sectors increase their vulnerability to any single economic or regulatory development. This may result in greater share price volatility. While the Fund is actively managed, the Fund’s investment process is expected to be heavily dependent on quantitative models, and the models may not perform as intended. Please read the Fund’s prospectus for specific details regarding the Fund’s risk profile.
You cannot invest directly in an index.
Categories
About the contributor

Global Head of Research
Christopher Gannatti began at WisdomTree as a Research Analyst in December 2010, working directly with Jeremy Schwartz, CFA®, Director of Research. In January of 2014, he was promoted to Associate Director of Research where he was responsible to lead different groups of analysts and strategists within the broader Research team at WisdomTree. In February of 2018, Christopher was promoted to Head of Research, Europe, where he was based out of WisdomTree’s London office and was responsible for the full WisdomTree research effort within the European market, as well as supporting the UCITs platform globally. In November 2021, Christopher was promoted to Global Head of Research, now responsible for numerous communications on investment strategy globally, particularly in the thematic equity space. Christopher came to WisdomTree from Lord Abbett, where he worked for four and a half years as a Regional Consultant. He received his MBA in Quantitative Finance, Accounting, and Economics from NYU’s Stern School of Business in 2010, and he received his bachelor’s degree from Colgate University in Economics in 2006. Christopher is a holder of the Chartered Financial Analyst Designation.